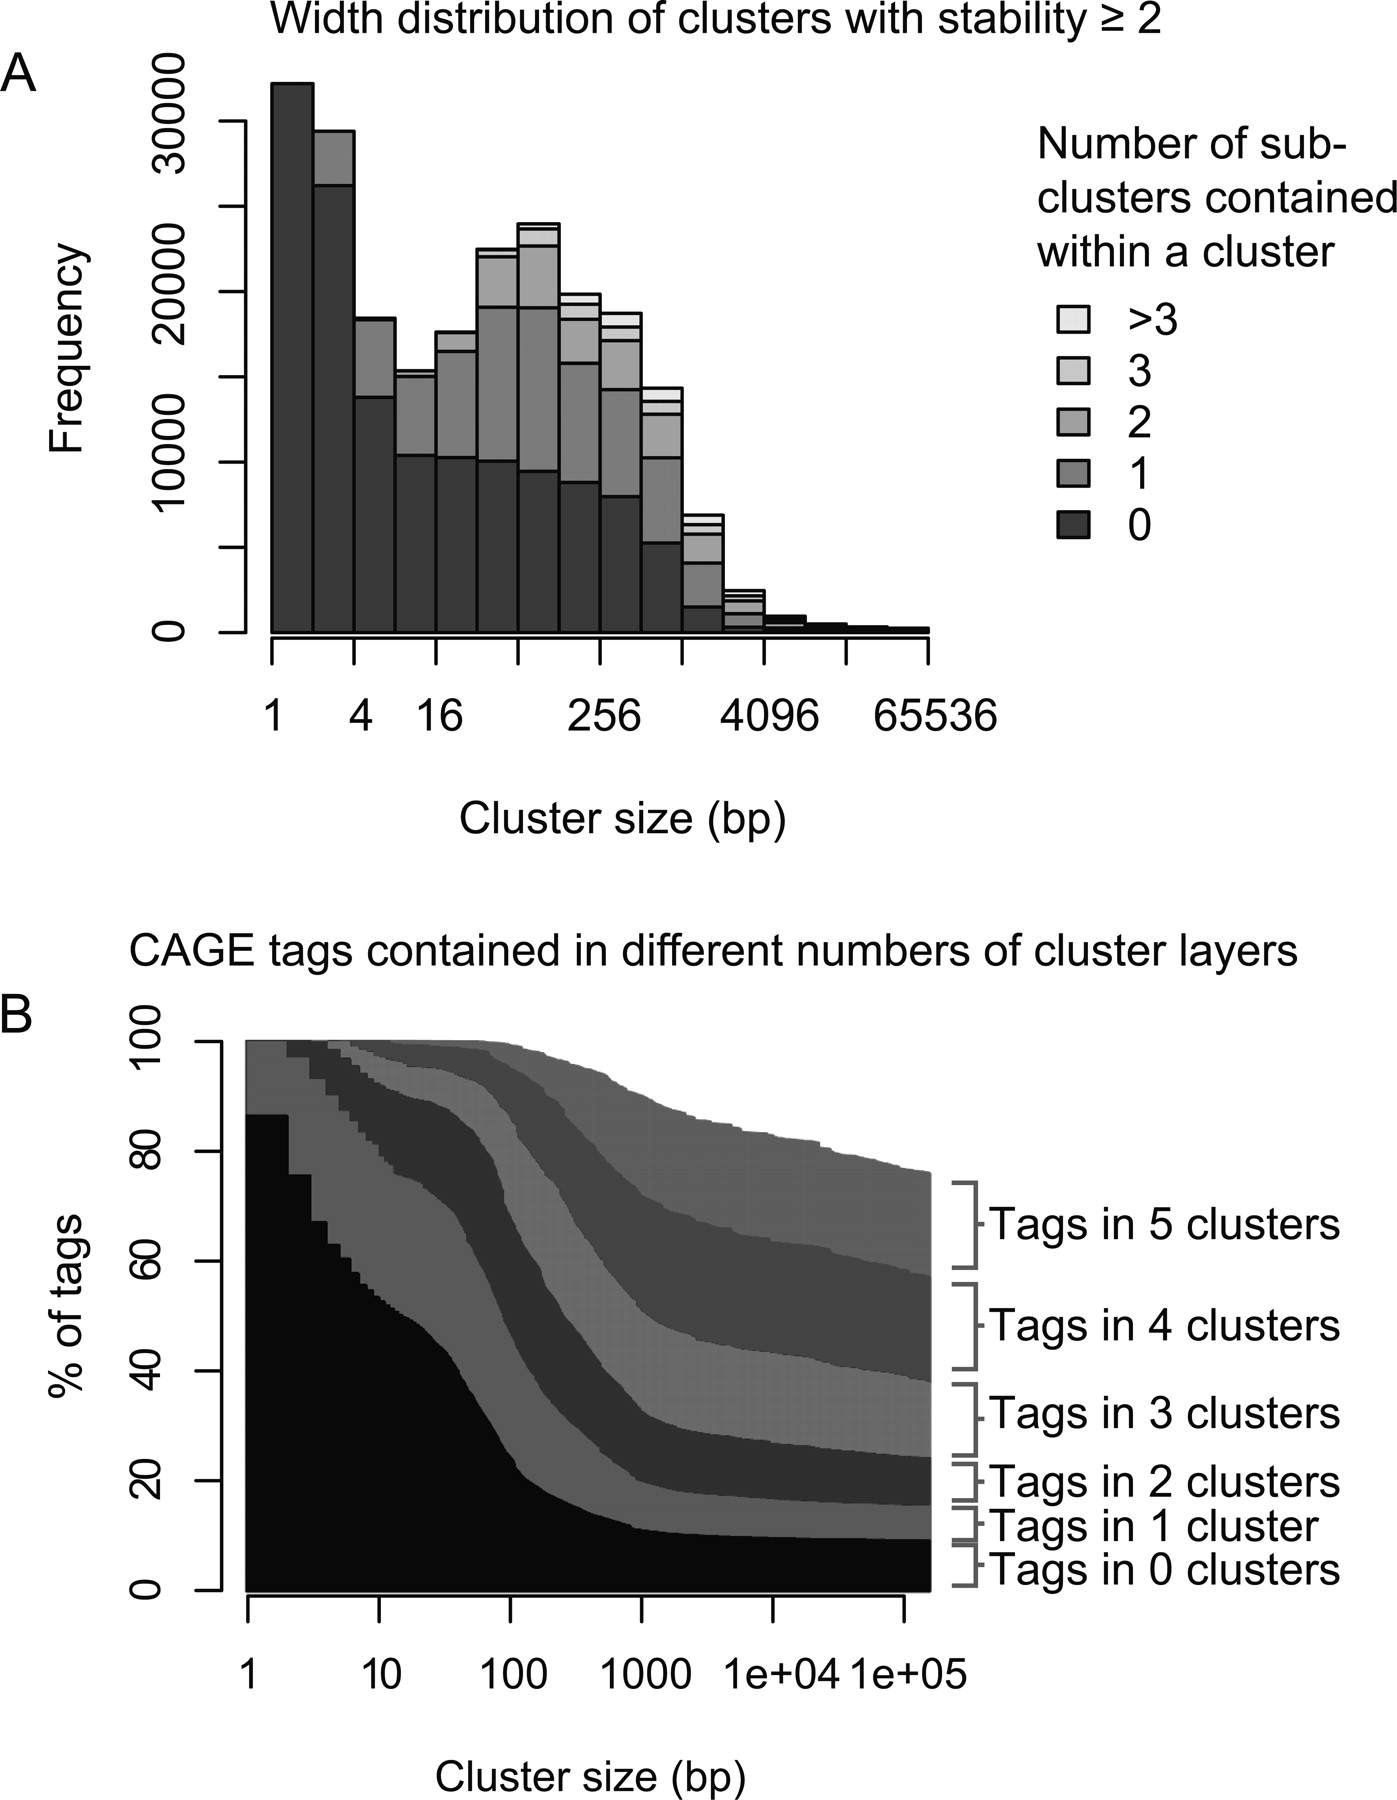
Properties of transcription initiation clusters. (A) Size distribution and numbers of subclusters. Clusters were binned according to their size, and the number of clusters in each size bin is plotted as a histogram. Within each size bin, the clusters are subdivided according to how many subclusters they contain (not counting sub-sub-clusters, etc). (B) Percentage of CAGE tags contained in multiple layers of clusters within clusters. The fraction of tags contained within 0, 1, or more clusters is shown for varying cluster sizes (X-axis); when only small clusters are considered, most tags are isolated, but when large clusters are considered, most tags lie in multiple layers of clusters. In both panels, only stable clusters (stability ≥2) are considered.