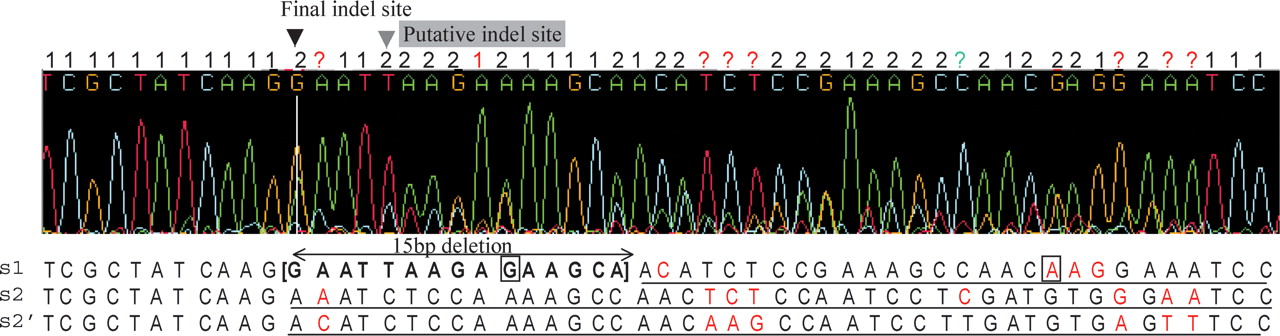
An example of decoding the two sequences in the peak-overlapping region using ambiguous sites. The read covers exon 19 of EGFR. (Top) The double-peak sites (2), single-peak sites (1), and ambiguous sites (?) calculated using Phigh = 30 and Plow = 15 are labeled. The two decoded sequences, s1 and s2, are displayed below. s2′ is an alternative representation of s2 that incorporates the bases at the secondary peaks at the ambiguous sites. The alignment between s1 and s2 has a 15-bp deletion in s2 (bold). The aligned bases after the deletion in s1, s2, and s2′ are underlined. The ambiguous sites are labeled in red in s1, s2, and s2′. Seven out of the eight ambiguous sites show that bases in s2′ match those in s1 in the alignment after the 15-bp deletion (red “?” at top). At the remaining ambiguous site (green “?” at top), the base in s2 matches s1 but not that of s2′. One single-base site is labeled (red) because neither s2 nor s2′ matches s1 at this site. Two sites in s1 are labeled (boxes) because the bases represented by their secondary peaks are selected for s1. In this instance, s2′ best represents the sequence of the deletion allele, while s1 represents the sequence of the wild-type allele. The final indel position computed in step 3 is 4 bp upstream of the putative indel site found by step 1.