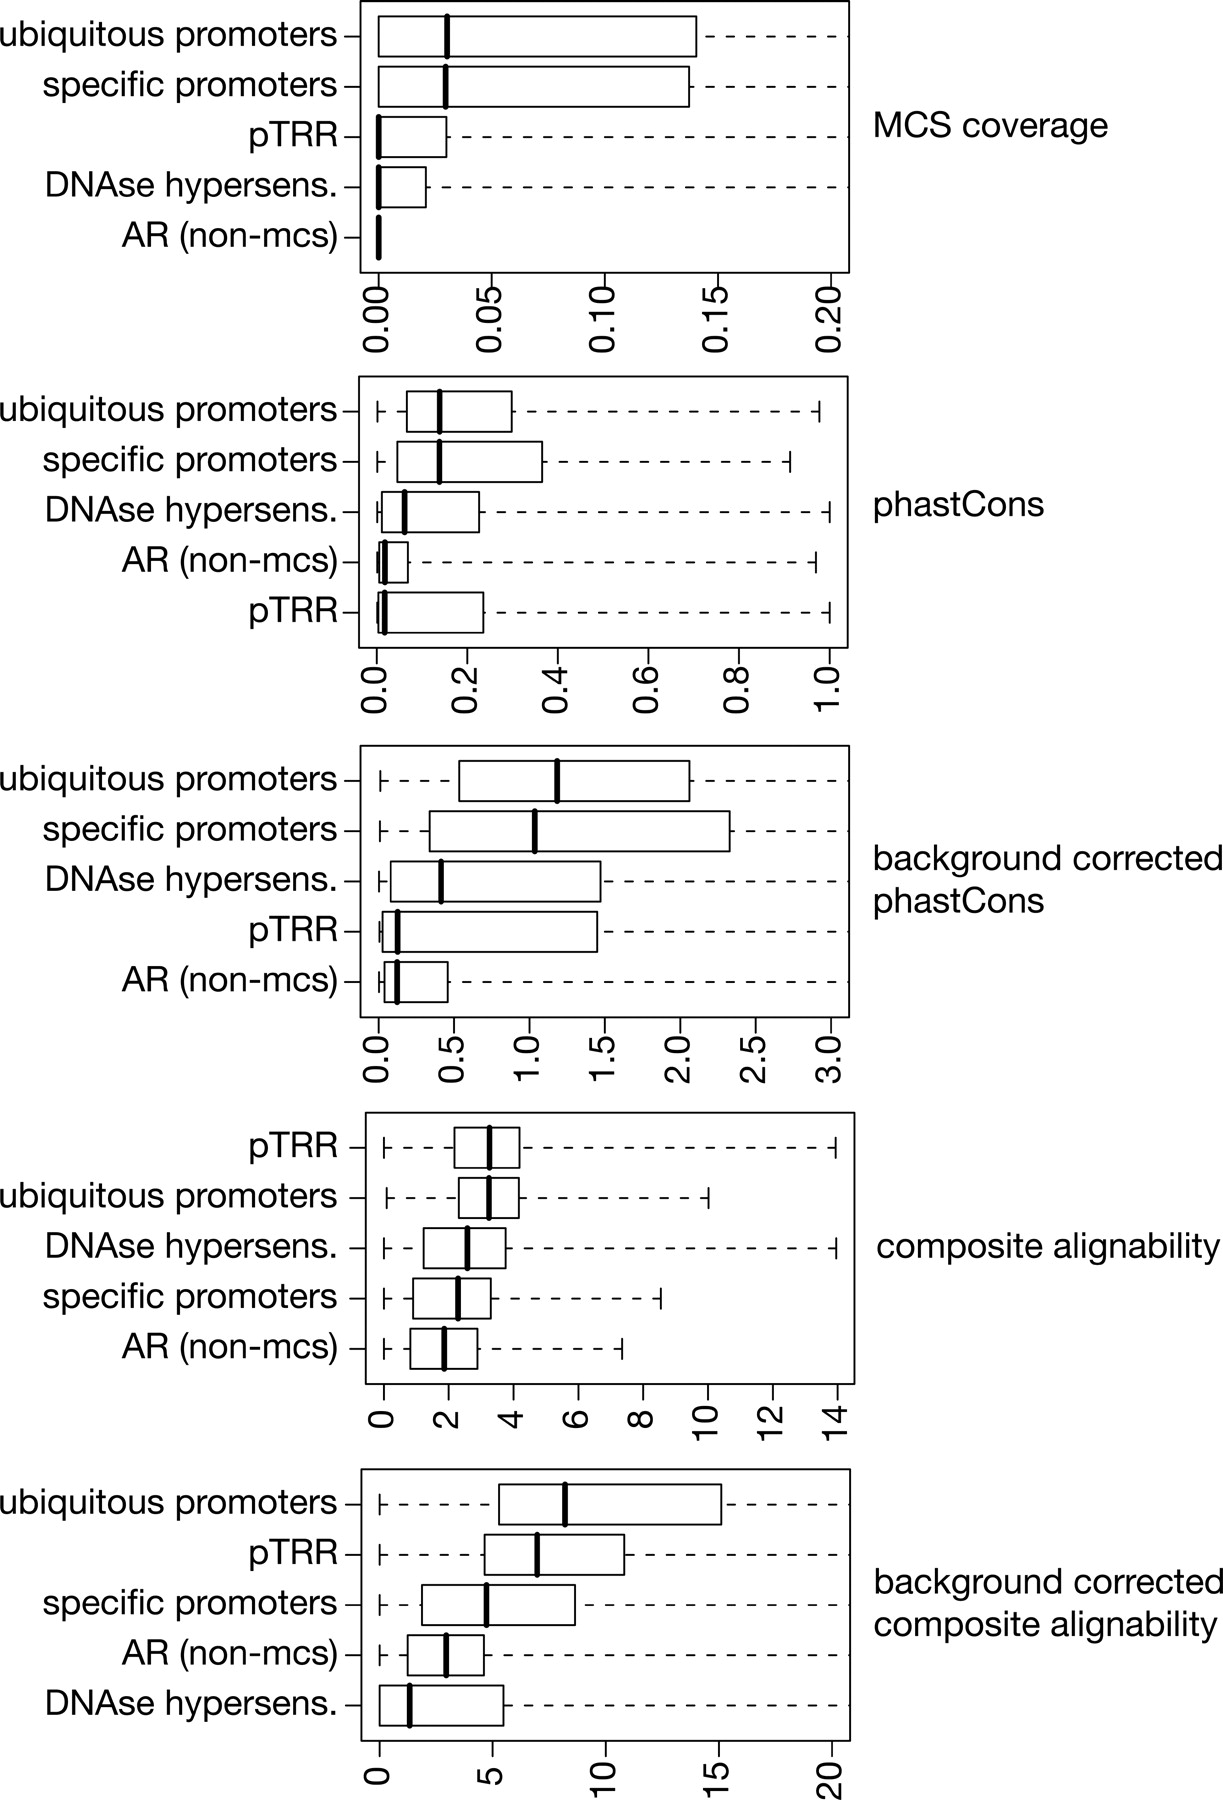
Distributions of scores in regulatory regions for alignment-based measures. Each panel shows the score distributions as box plots, with the box extending from the 25th to 75th percentiles and the vertical line giving the median. The distribution boxes are ordered by the medians of each data set. The graph for MCS coverage shows the fraction covered by MCSs (Margulies et al. 2007). The phastCons score (Siepel et al. 2005) is a likelihood of being in the slowly changing class of genomic sequences; the graph shows the average phastCons value per interval. For the background corrected phastCons score, the graph shows the interval average divided by the regional average. The composite alignability score, before and after background correction is in arbitrary units. In all cases, larger numbers reflect greater constraint (MCS coverage and phastCons) or greater conservation (composite alignability).