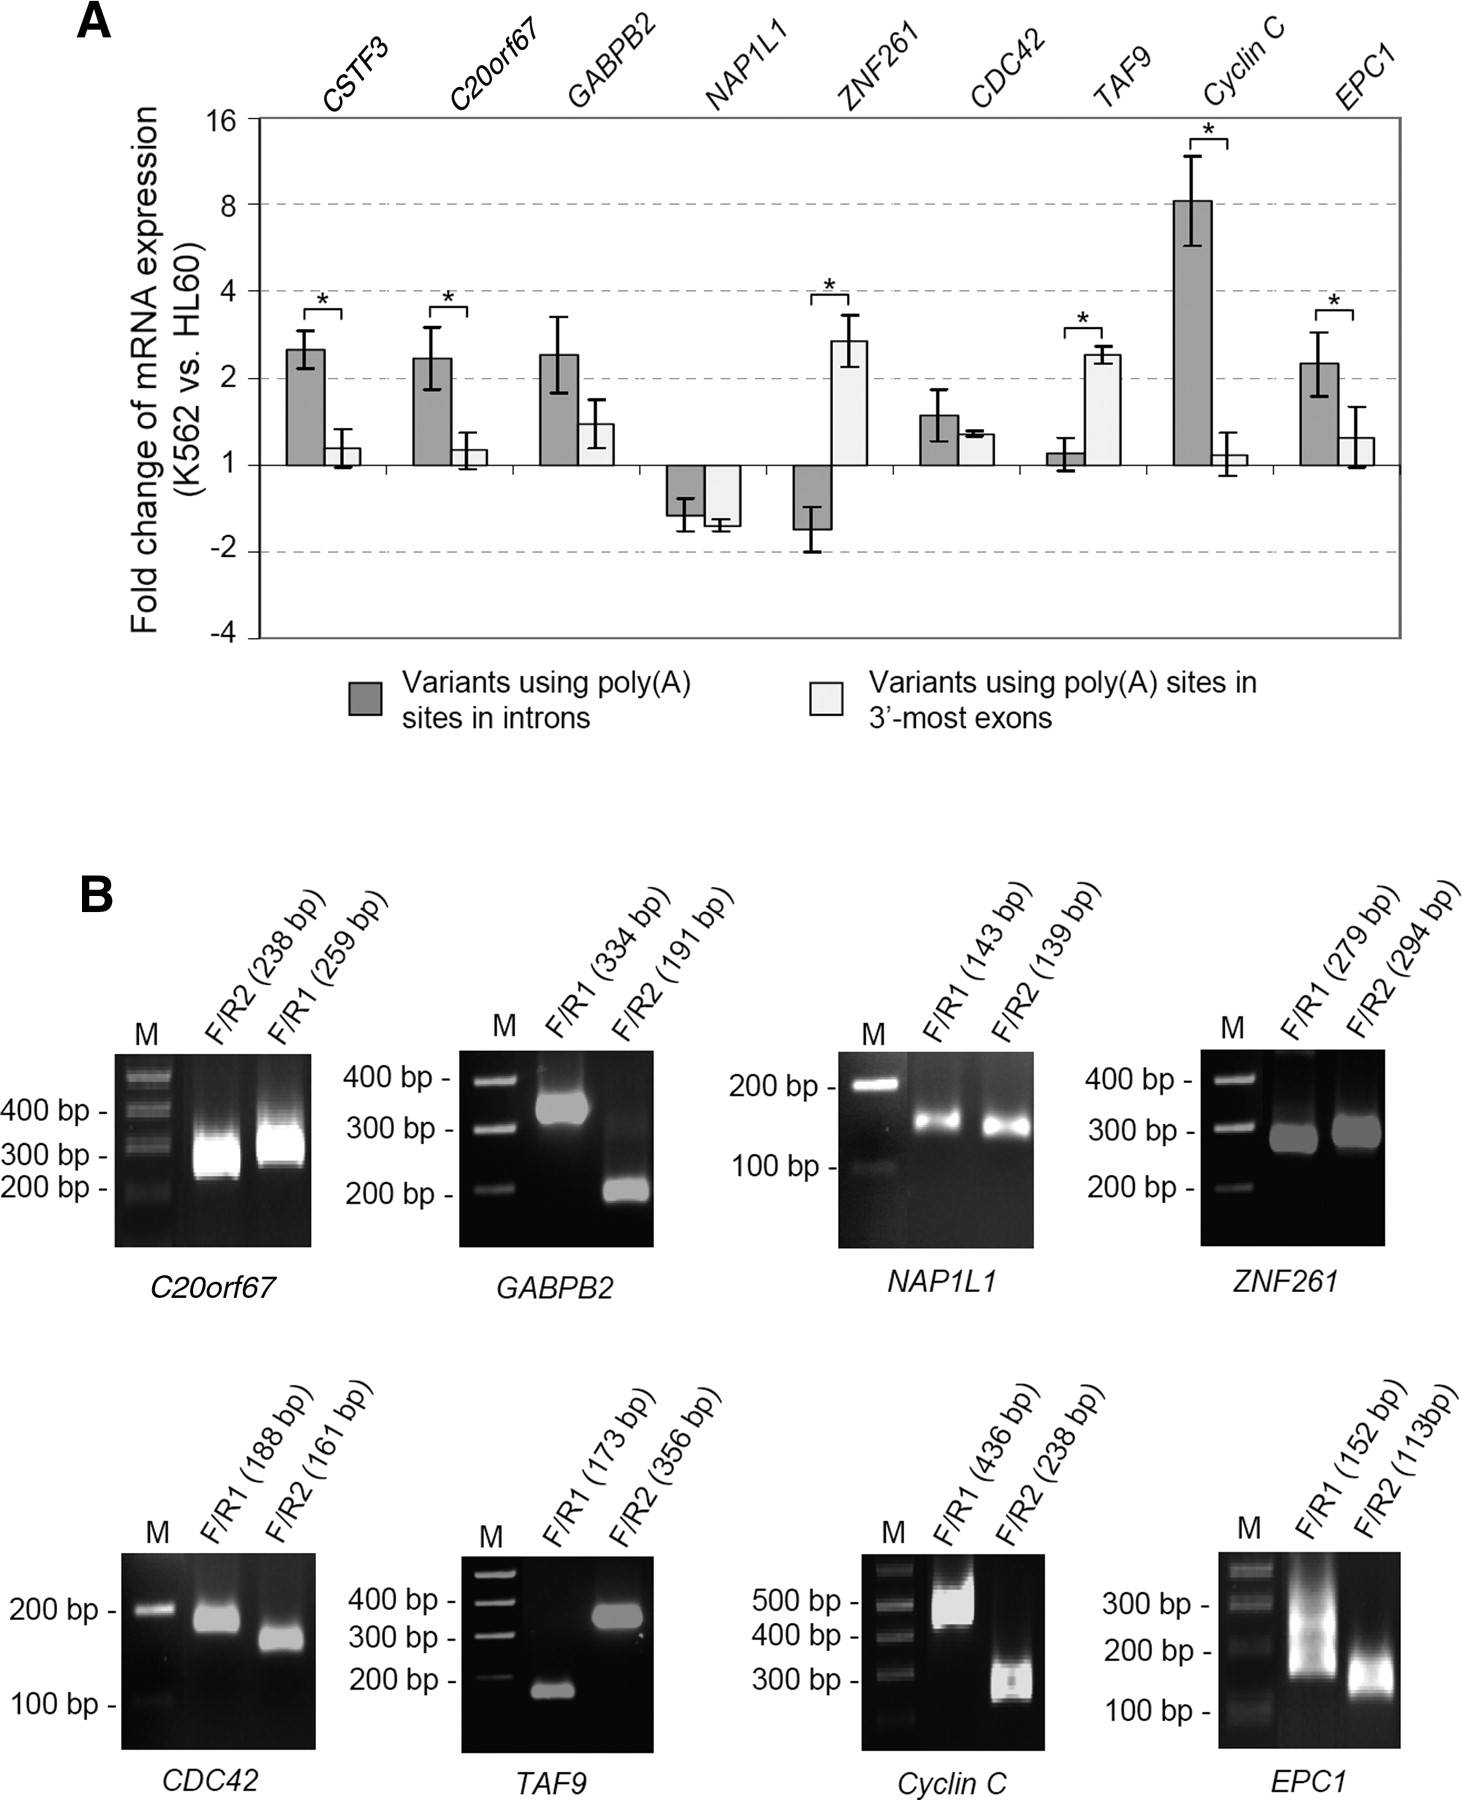
Intronic polyadenylation activity varies between cell lines. (A) QPCR results of nine genes that contain intronic poly(A) sites. For each gene, two sets of primers were used to detect the mRNA variant(s) generated by intronic polyadenylation and the mRNA variant(s) generated by polyadenylation in the 3′-most exon. For each variant type, the mRNA expression level (QPCR value) from K562 cells was compared with that from HL60 cells. For each gene, fold changes of intronic polyadenylation variants and 3′-most exon variants were compared, and those significantly different (P-value < 0.05, t-test) are indicated by asterisks. The result is based on two experiments, each with samples in duplicate. Error bar is SD. (B) PCR products using mRNAs from human K562 cells. M indicates molecular marker; F/R1, products by primers F and R1; and F/R2, products by primers F and R2 (for primer sequences and their targeted regions, see Supplemental Fig. 4). The expected molecular weight based on supporting cDNA/ESTs for each PCR product is indicated above each lane.