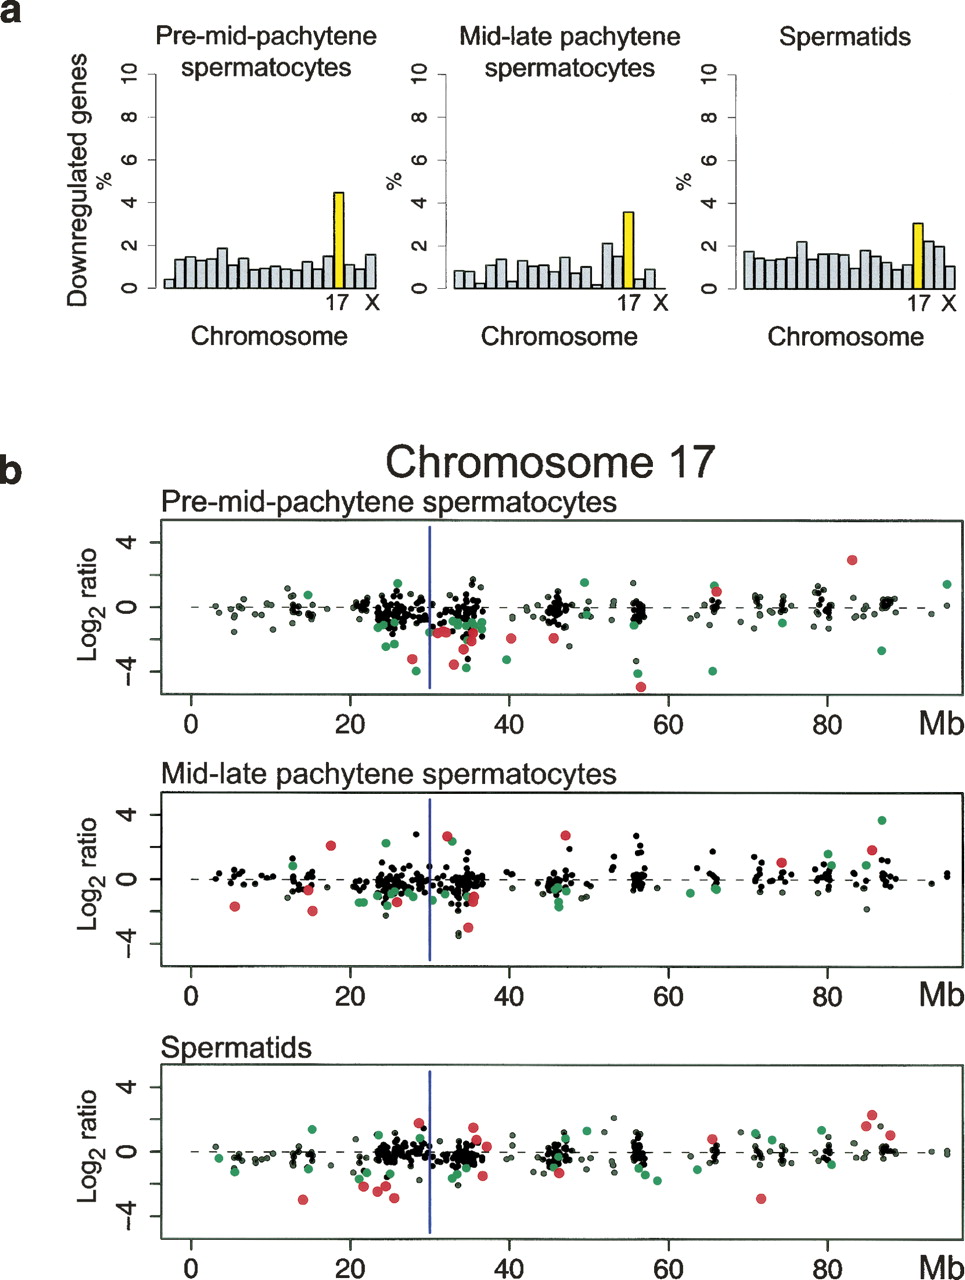
Down-regulation of genes in the vicinity of the translocation breakpoint. (a) Percentage of down-regulated genes in individual chromosomes of sterile B10-T43/+ males compared to fertile controls (B10 and B10-T43/T43). Significant enrichment of down-regulated genes (P < 0.05) was found on chromosome 17 (yellow) in pre-mid-pachytene spermatocytes (P ≤ 0.0018; one-tailed Fisher exact tests). (b) Expression changes between sterile and fertile males along chromosome 17 are shown in a logarithmic scale of base 2. These changes were calculated as [(BT/B + BT/T)/2], where BT, B, and T stand for the mean expression in B10-T43/+, B10, and B10-T43/T43 males, respectively. Significant expression differences are plotted in green (P < 0.05) and red (P < 0.01). Only the genes expressed in the specified cell population from males of at least one genotype are shown. (Blue line) The translocation breakpoint, localized at ∼30 Mb.