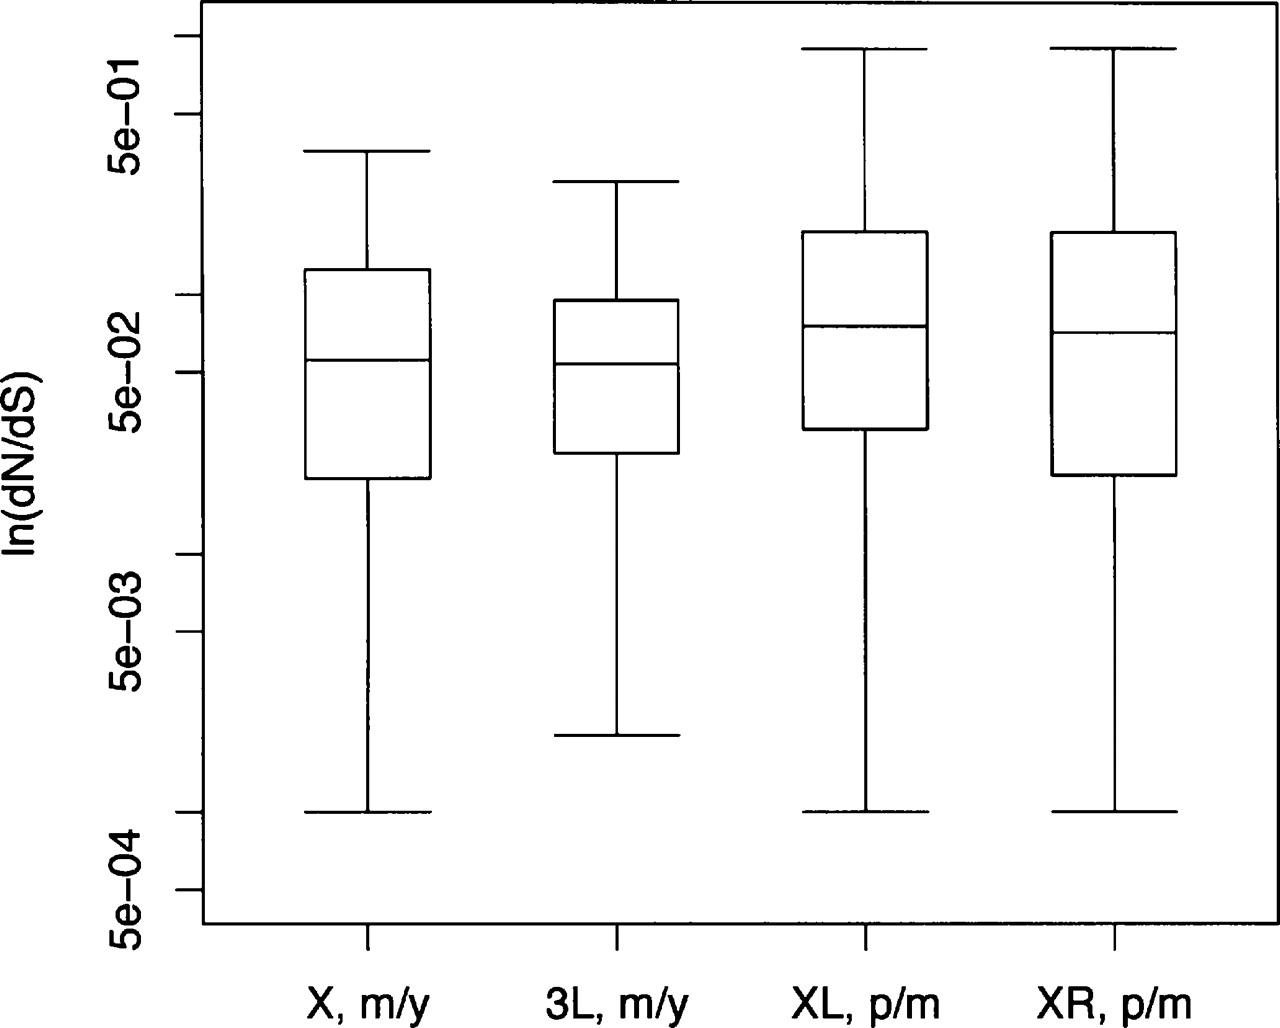
Figure 2.
Summaries of the distribution of dN/dS ratios for the 202 loci analyzed in the four-species comparison. Rectangles surround the quantiles of the distribution (25-th, 50-th, and 75-th percentiles), with lines extending out to the 2.5-th and 97.5-th percentiles. (m/y) dN/dS between D. melanogaster and D. yakuba; (p/m) dN/dS between D. pseudoobscura and D. miranda.