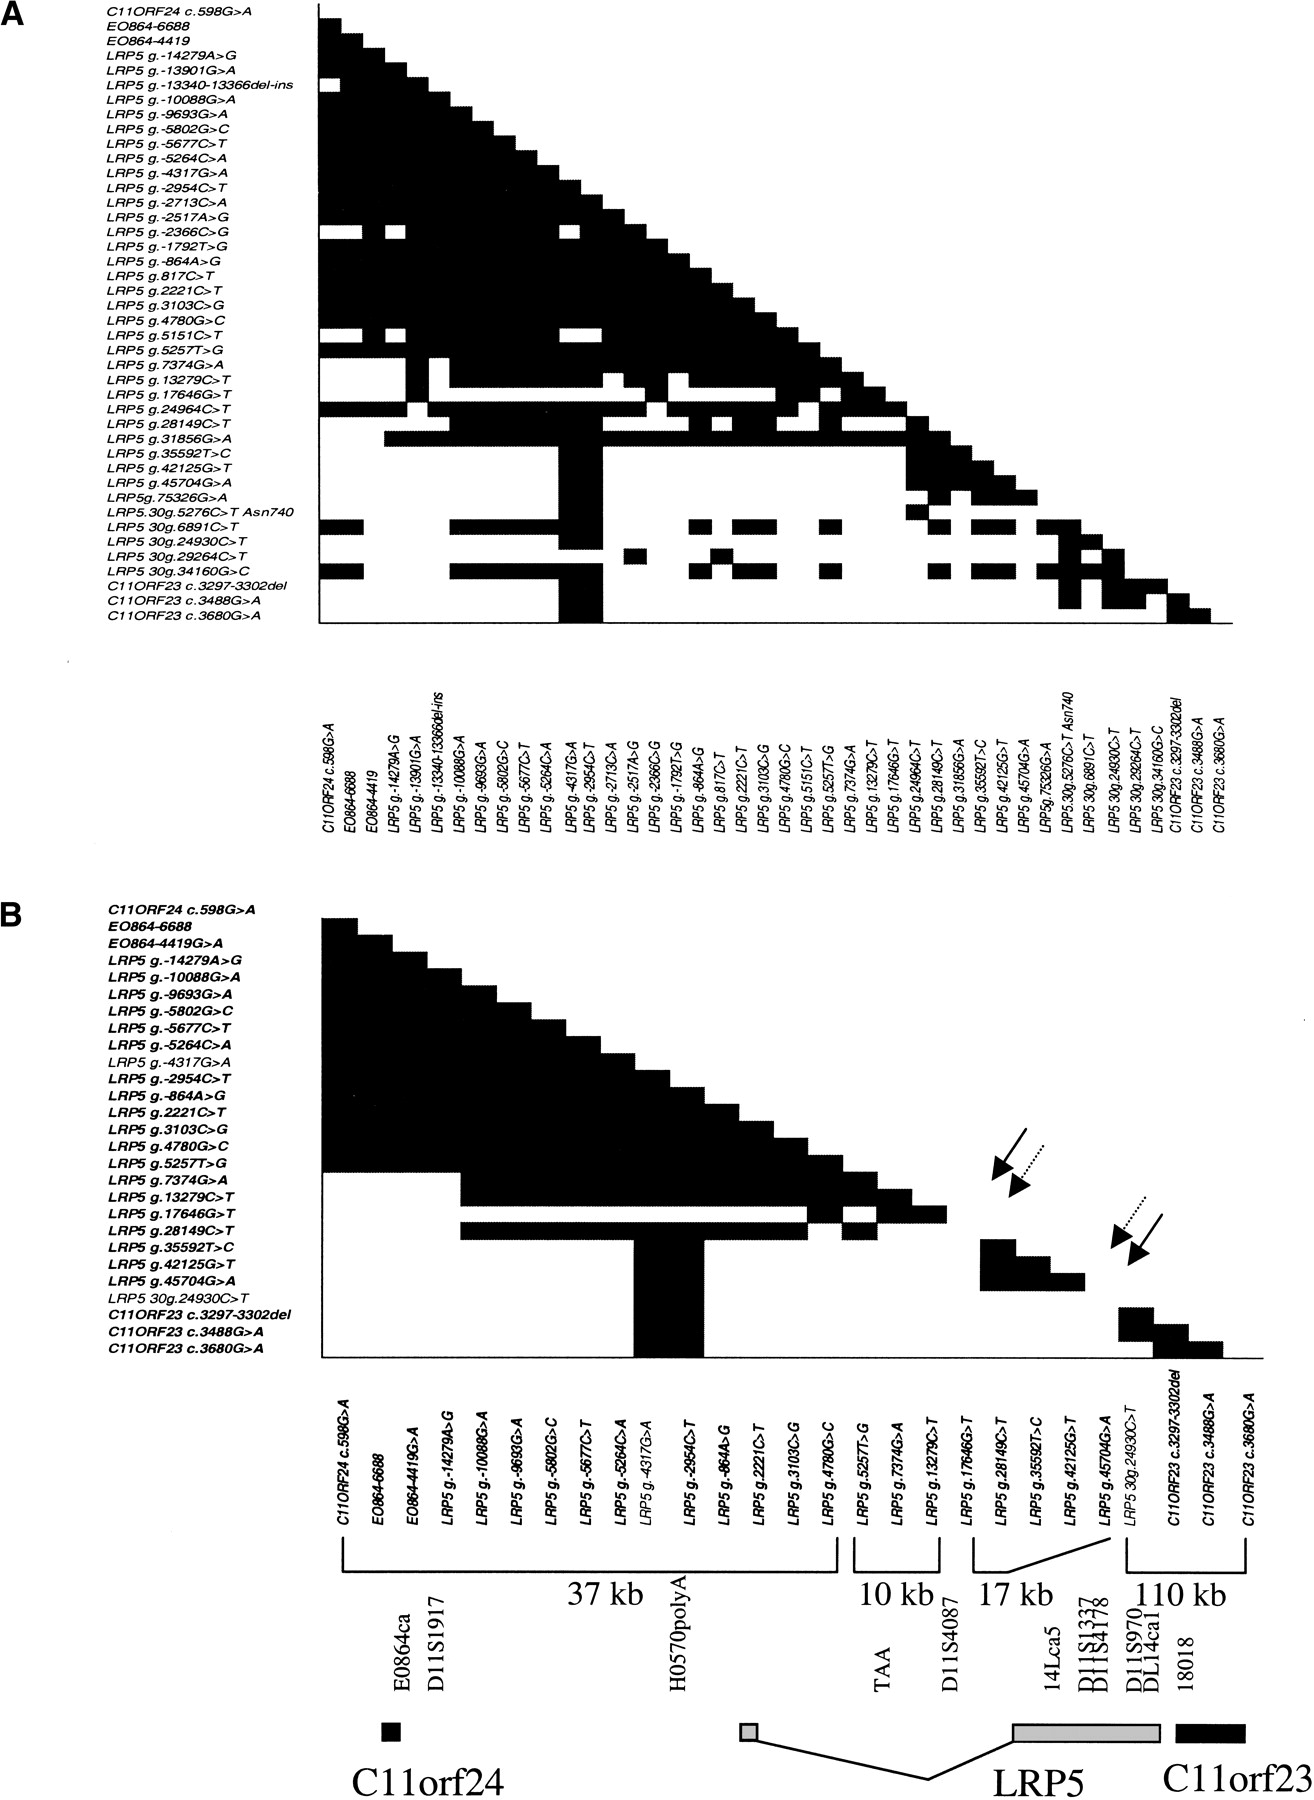
Figure 2.
Plot of pairwise ‖D‘‖ values against distance (in base pairs) for 42 SNPs in 364 UK chromosomes. ‖D‘‖ values of 0.8 or more are shaded black. (A) Pairwise ‖D‘‖ values for all SNPs in the 300-kb region. (B) Pairwise ‖D‘‖ values for the 27 SNPs with allele frequencies >0.20. The arrows show the location of the recombination hot spots.