Figure 2.
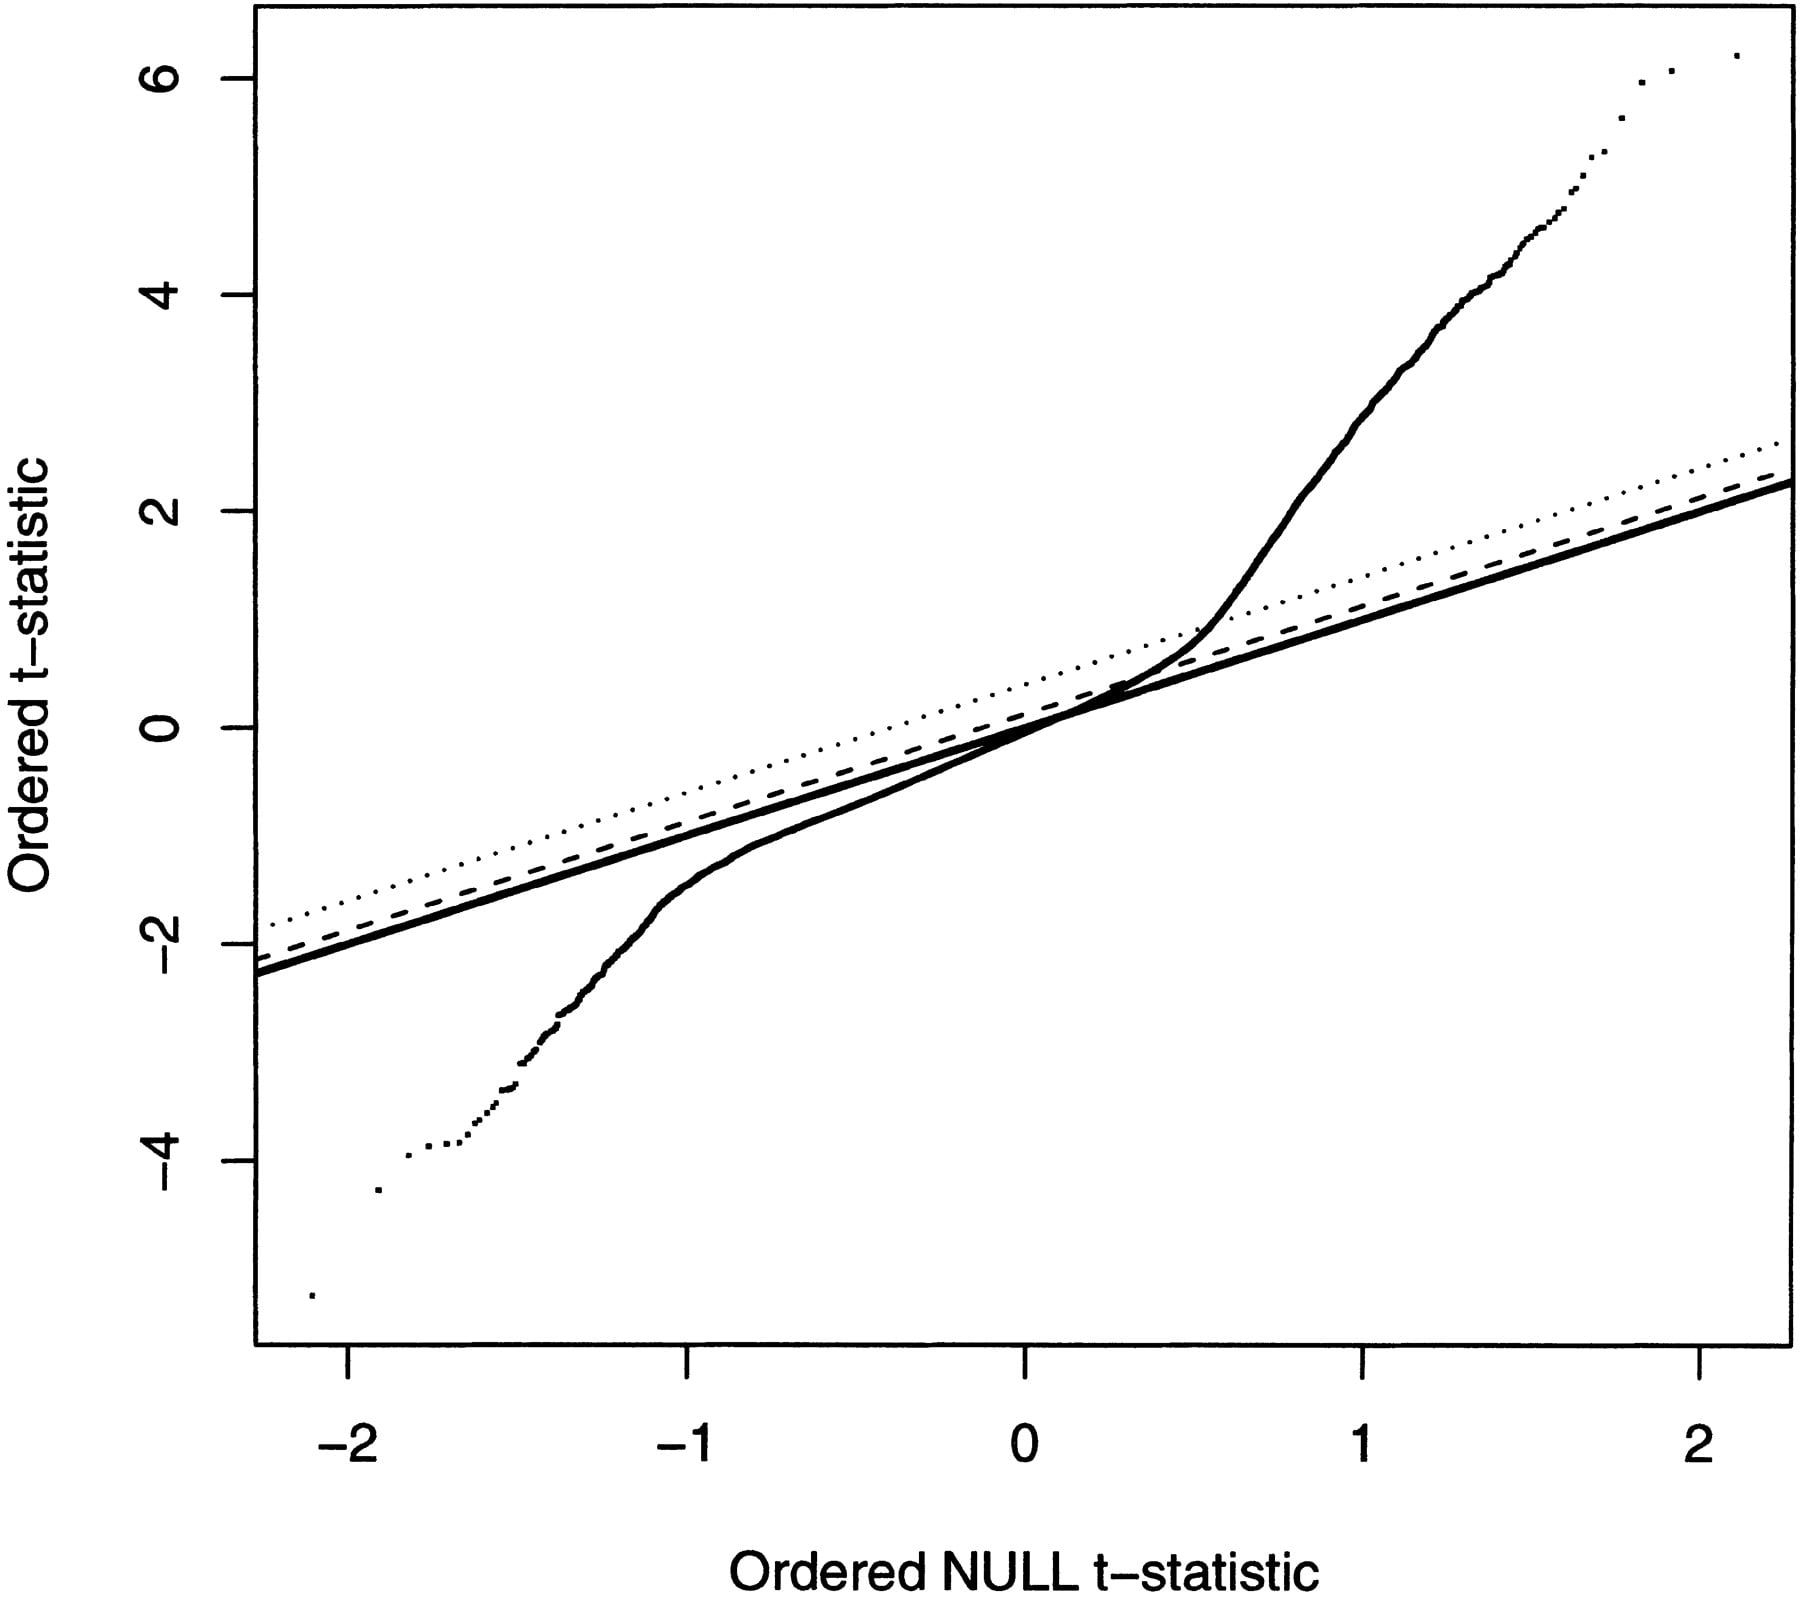
Distribution of t-statistics. The 92924 Col/Ler observed t-statistics are plotted against the expected “null” distribution (thick line). The dotted line represents a 5% FDR threshold. The dashed line represents an 18% FDR threshold.
Distribution of t-statistics. The 92924 Col/Ler observed t-statistics are plotted against the expected “null” distribution (thick line). The dotted line represents a 5% FDR threshold. The dashed line represents an 18% FDR threshold.