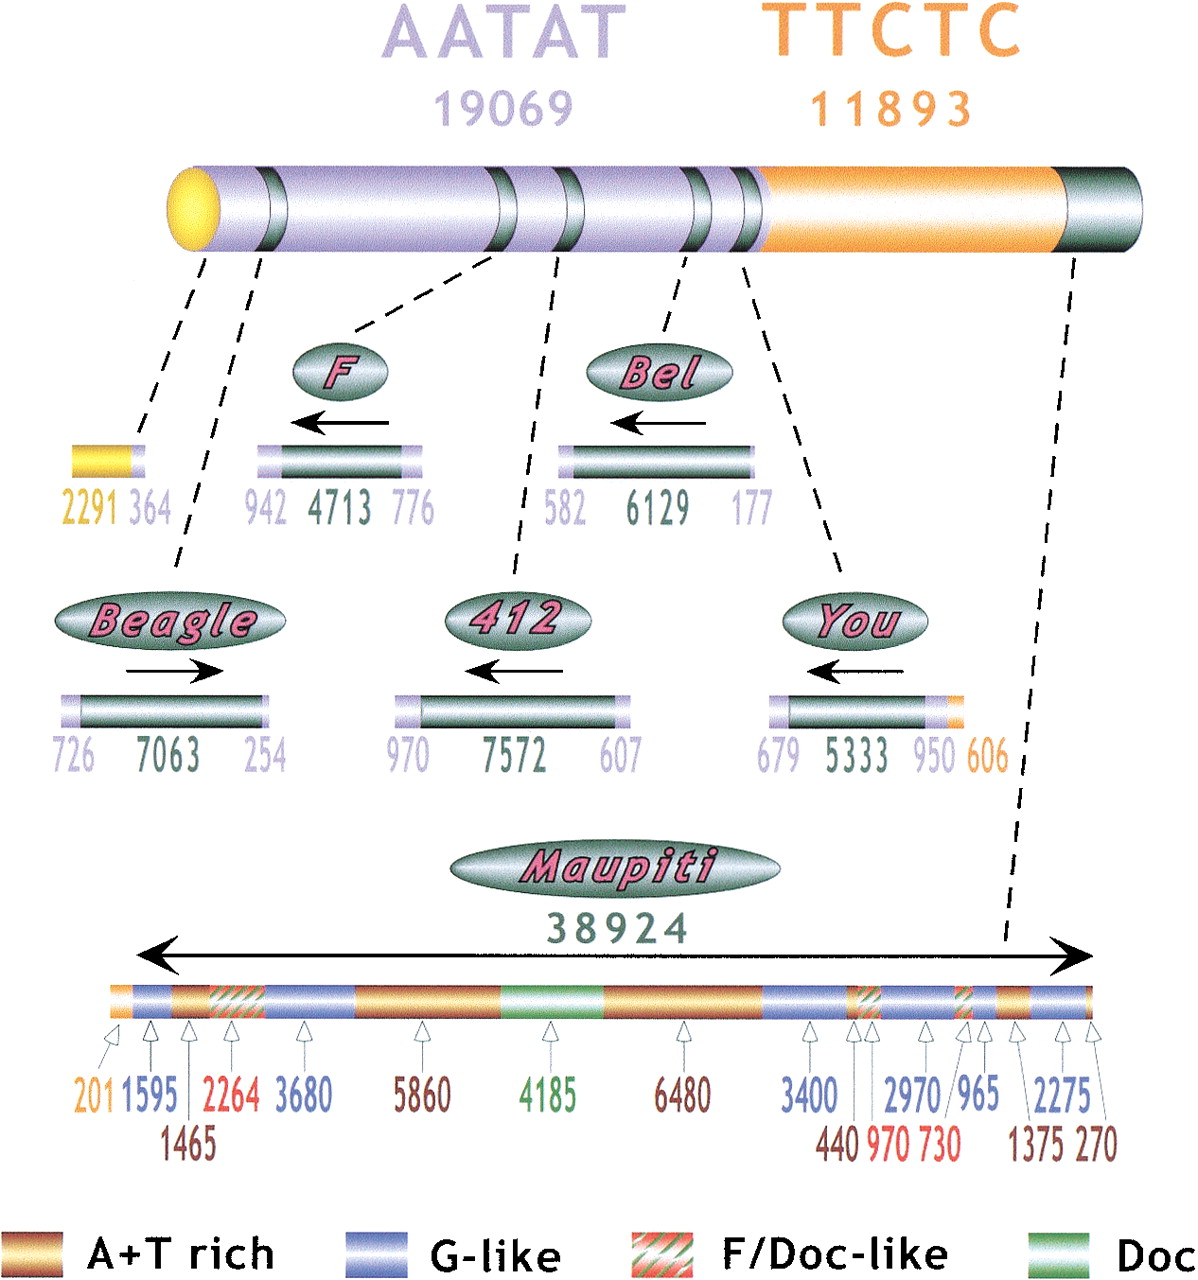
Figure 2.
Summary of γ1230 centromeric sequences. Numbers below AATAT and TTCTC report the total amount of sequence (base pairs) generated for each satellite, including blocks flanking complex DNA as well as the random, unmapped sequences generated by tagged PCR. Numbers below each transposon “bar” and the Maupiti diagram report the amount of contiguous sequence generated for each region and type of DNA, in base pairs. Arrows indicate the 5′ to 3′ orientation of the transposons, relative to previously sequenced euchromatic elements.