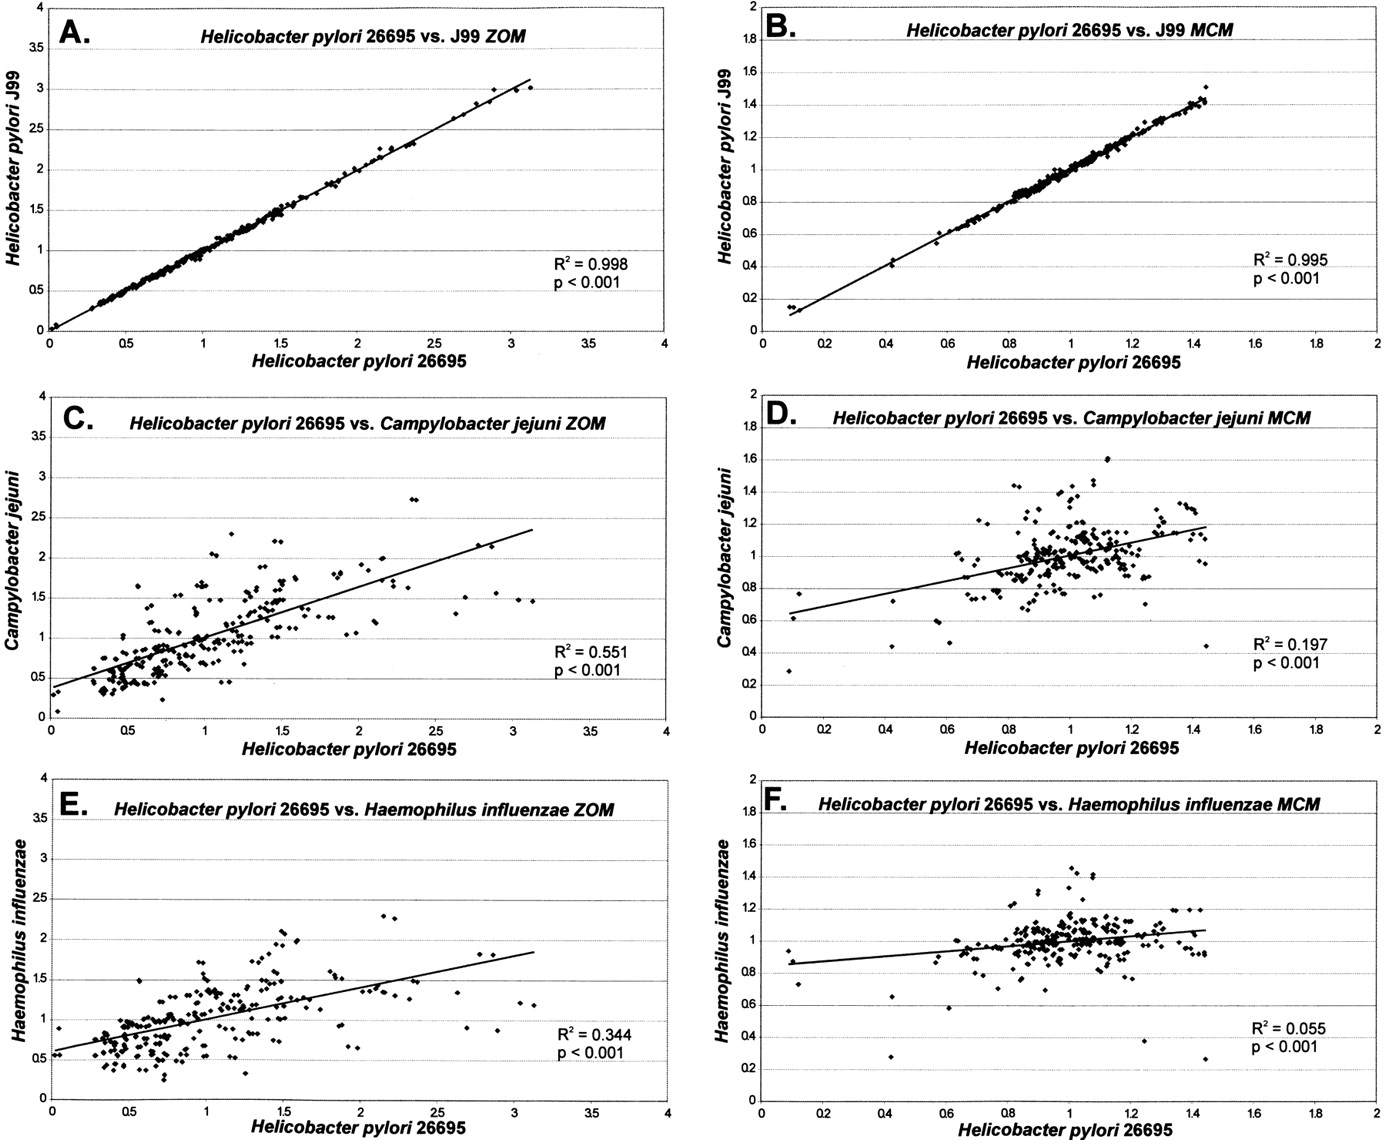
Figure 2.
Linear regression analysis of DNA tetranucleotide usage profiles among selected genomes. F(W) was determined for each of the 256 tetranucleotide combinations for each genome as described in Methods section, and the profiles compared by linear regression analysis. (A, C, E) Zero-order Markov analysis (ZOM). (B, D, F) Markov chain analysis (MCM).