Figure 2.
Plot of sensitivity versus specificity for each data source. Sensitivity and specificity were calculated over the full annotation set as described in Methods; see Table 2. Each data source is indicated by a different color and symbol.
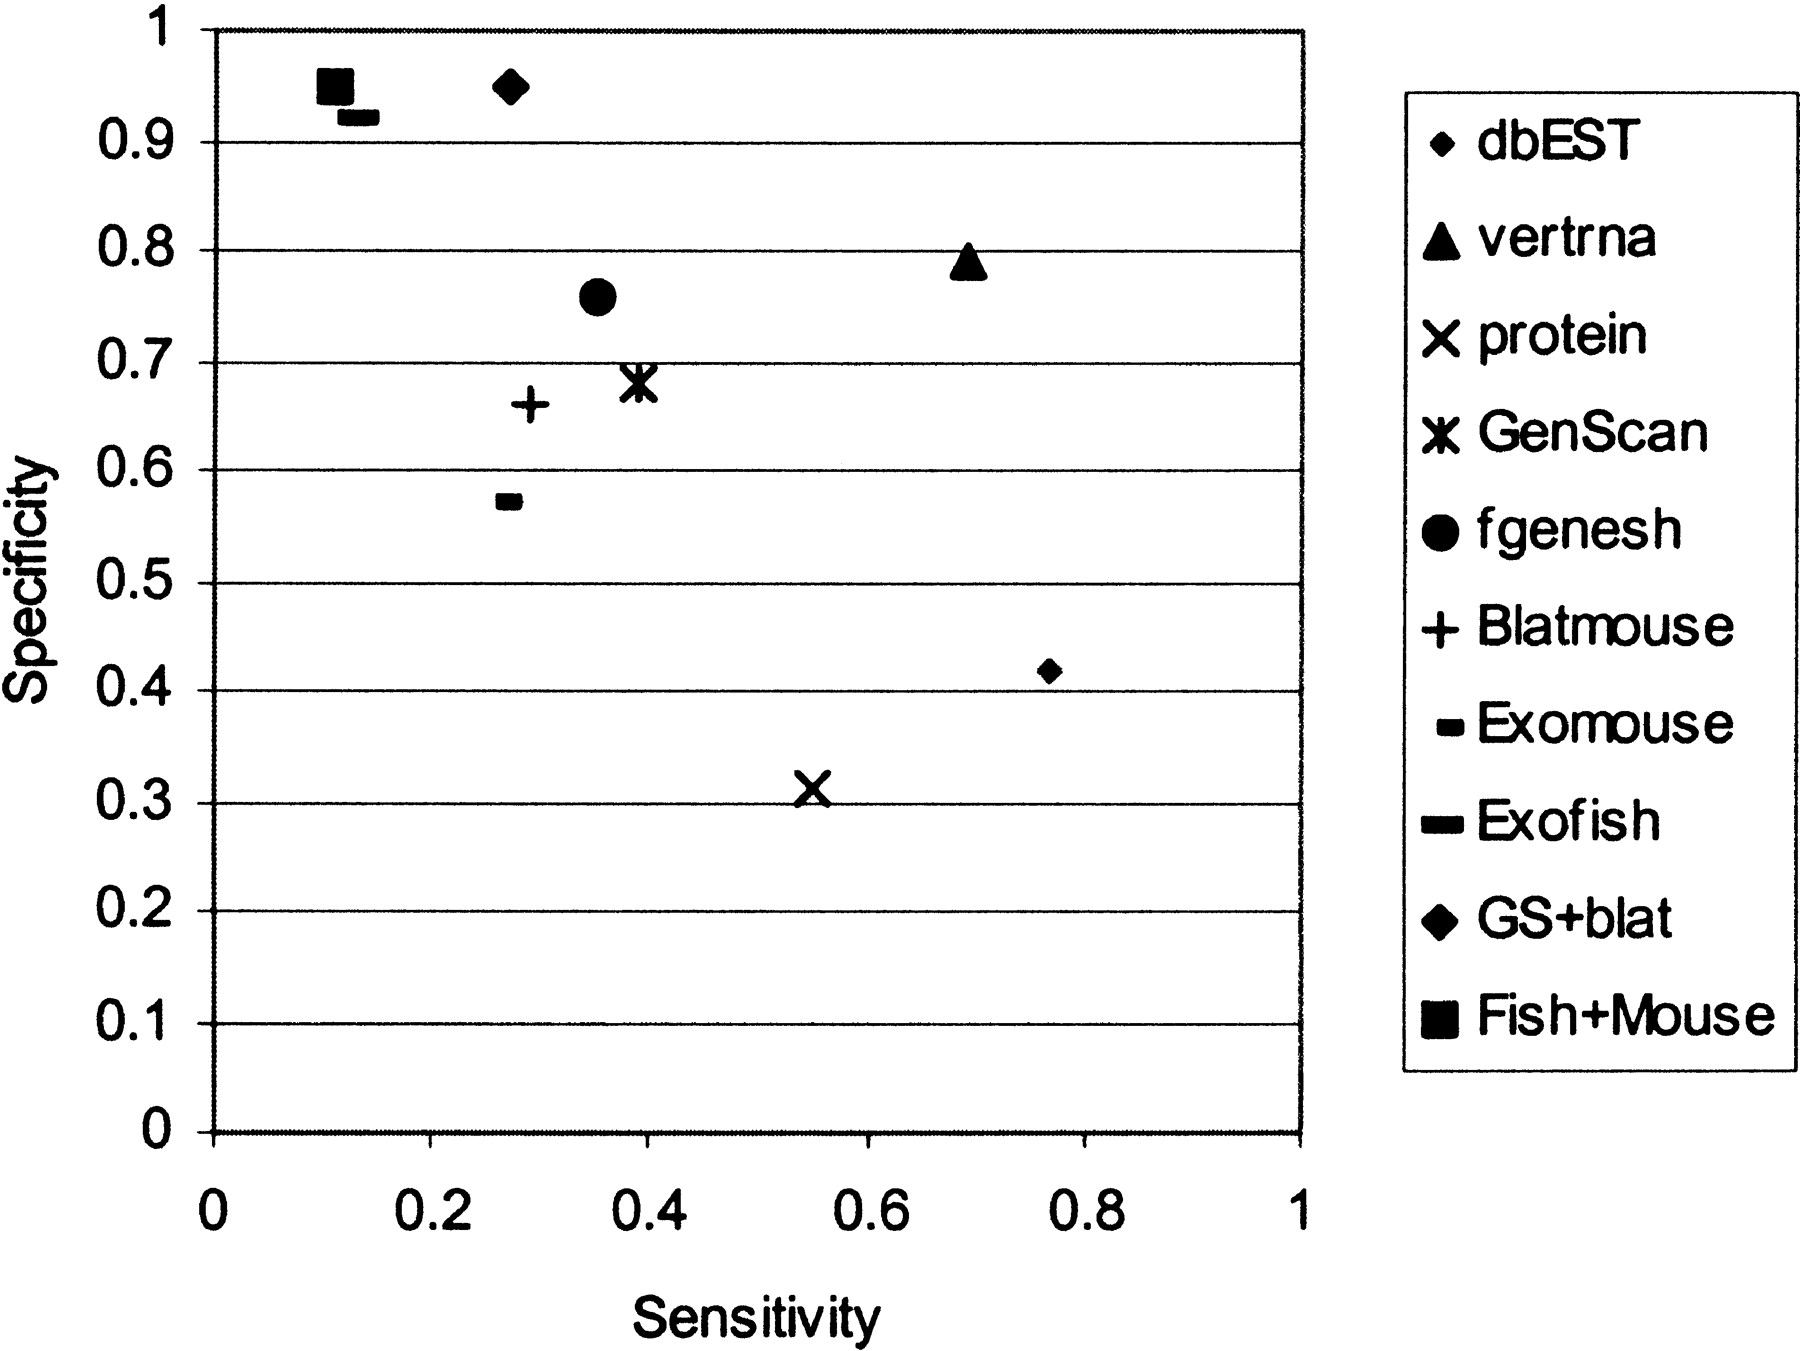
Plot of sensitivity versus specificity for each data source. Sensitivity and specificity were calculated over the full annotation set as described in Methods; see Table 2. Each data source is indicated by a different color and symbol.