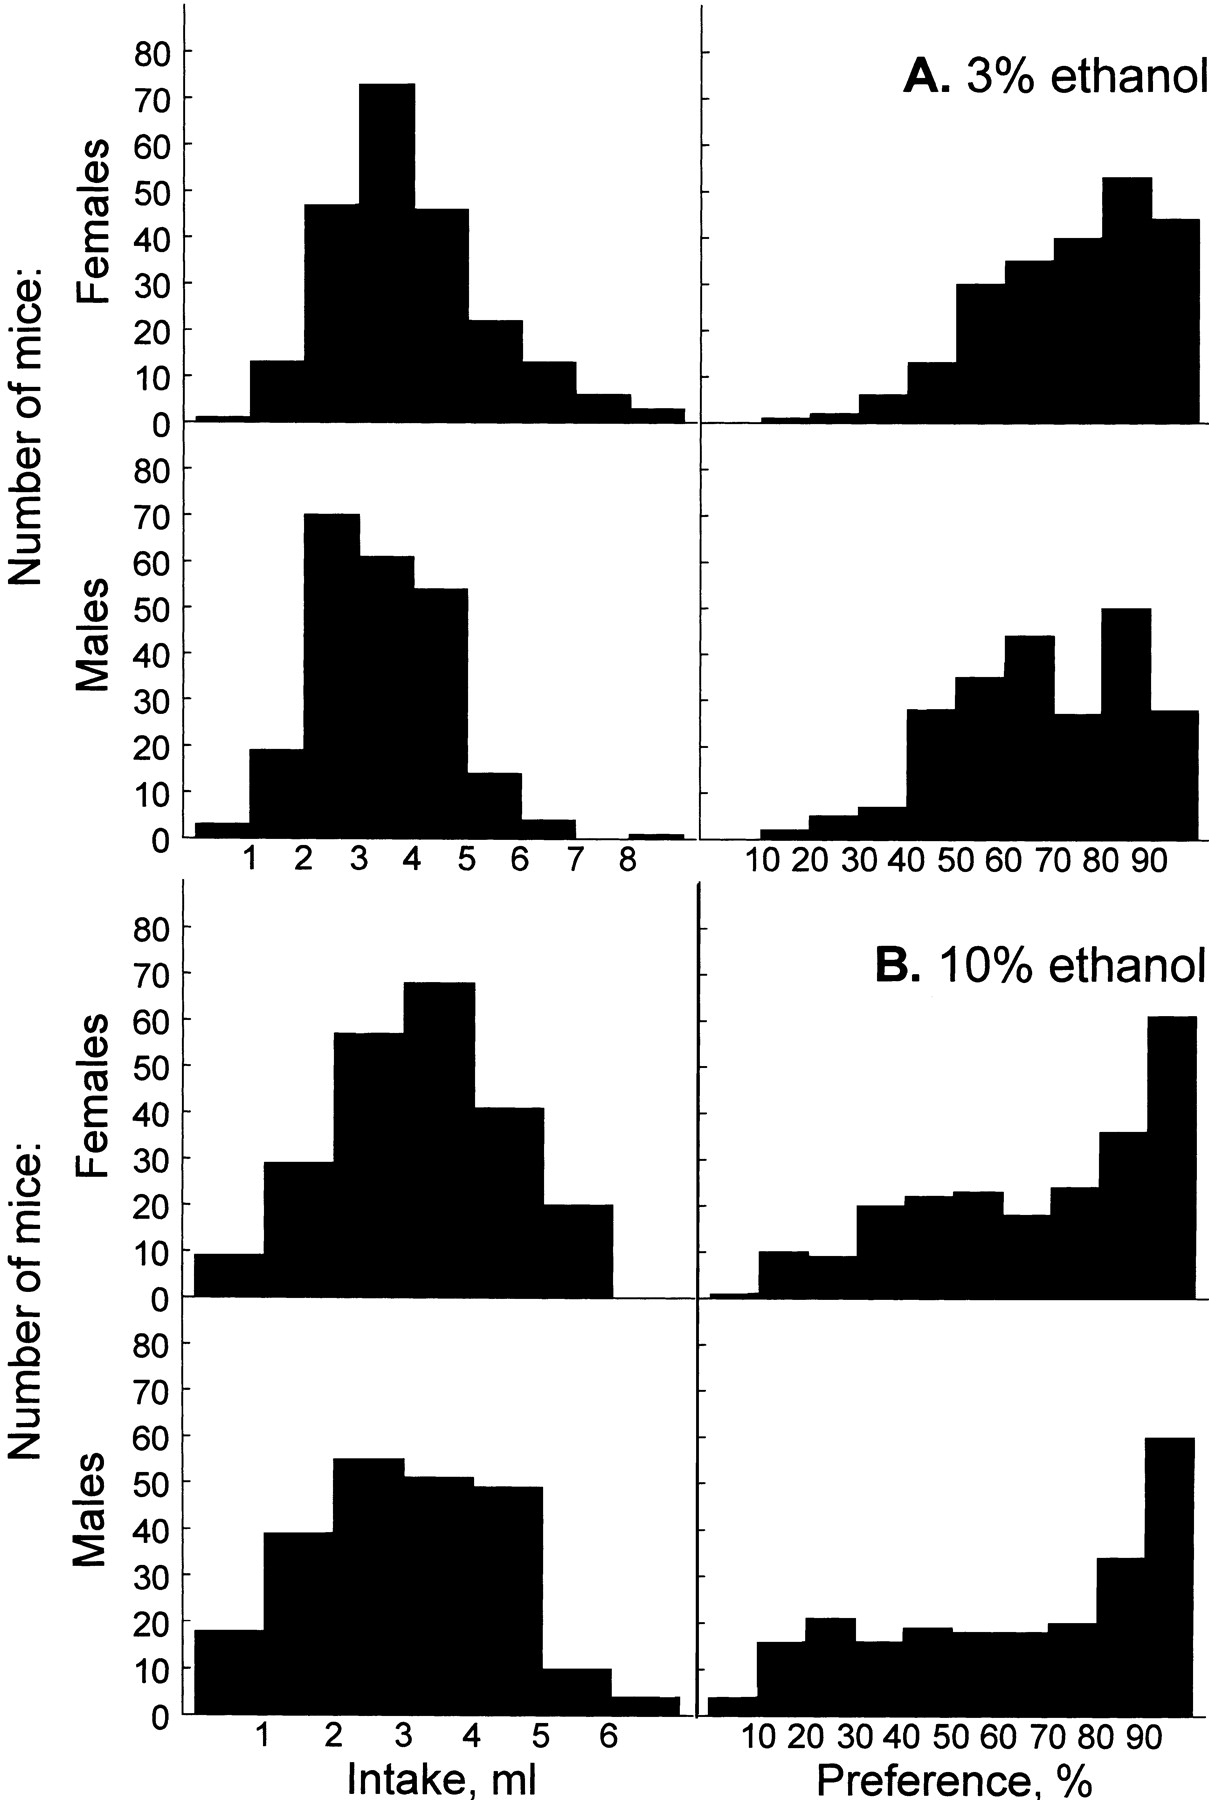
Figure 2.
Distributions of 3% (A) and 10% (B) ethanol intakes (left) and preferences (right) in F2 mice. Top rows, females (n = 224); bottom rows, males (n = 226).
Distributions of 3% (A) and 10% (B) ethanol intakes (left) and preferences (right) in F2 mice. Top rows, females (n = 224); bottom rows, males (n = 226).