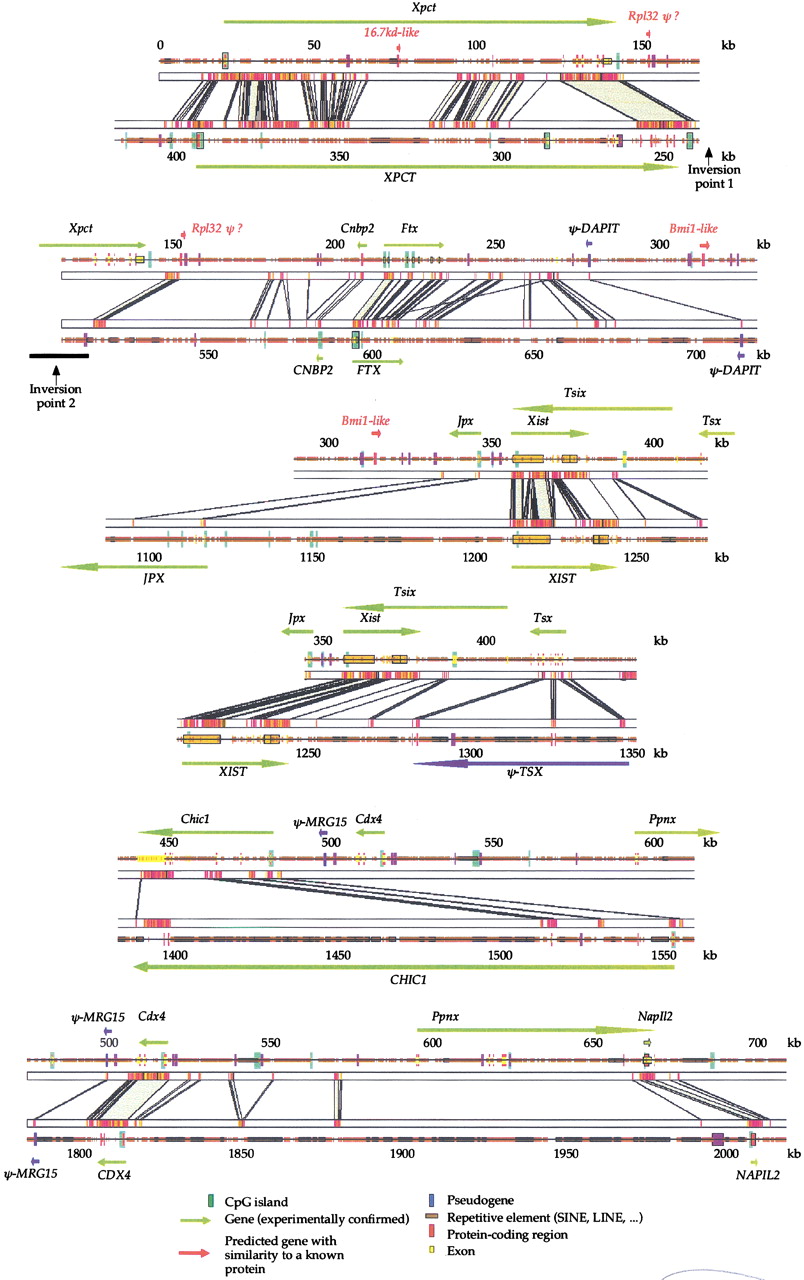
Figure 2.
Comparison of mouse and human genomic sequences in Xic region. Genomic sequences were first analyzed with RepeatMasker to identify and mask repeated elements and then aligned withSIM. Conserved blocks with a similarity score >30 are displayed (see Methods). An electronic version of this figure is available at http://pbil.univ-lyon1.fr/datasets/Xic2002/data.html. Because the alignment is very long and because of an inversion of theXpct gene, it was not possible to display the whole human–mouse comparison in a single continuous line. The alignment, therefore, is displayed in six overlapping fragments. The overlaps are designed to allow the continuity of the fragments to be better appreciated.