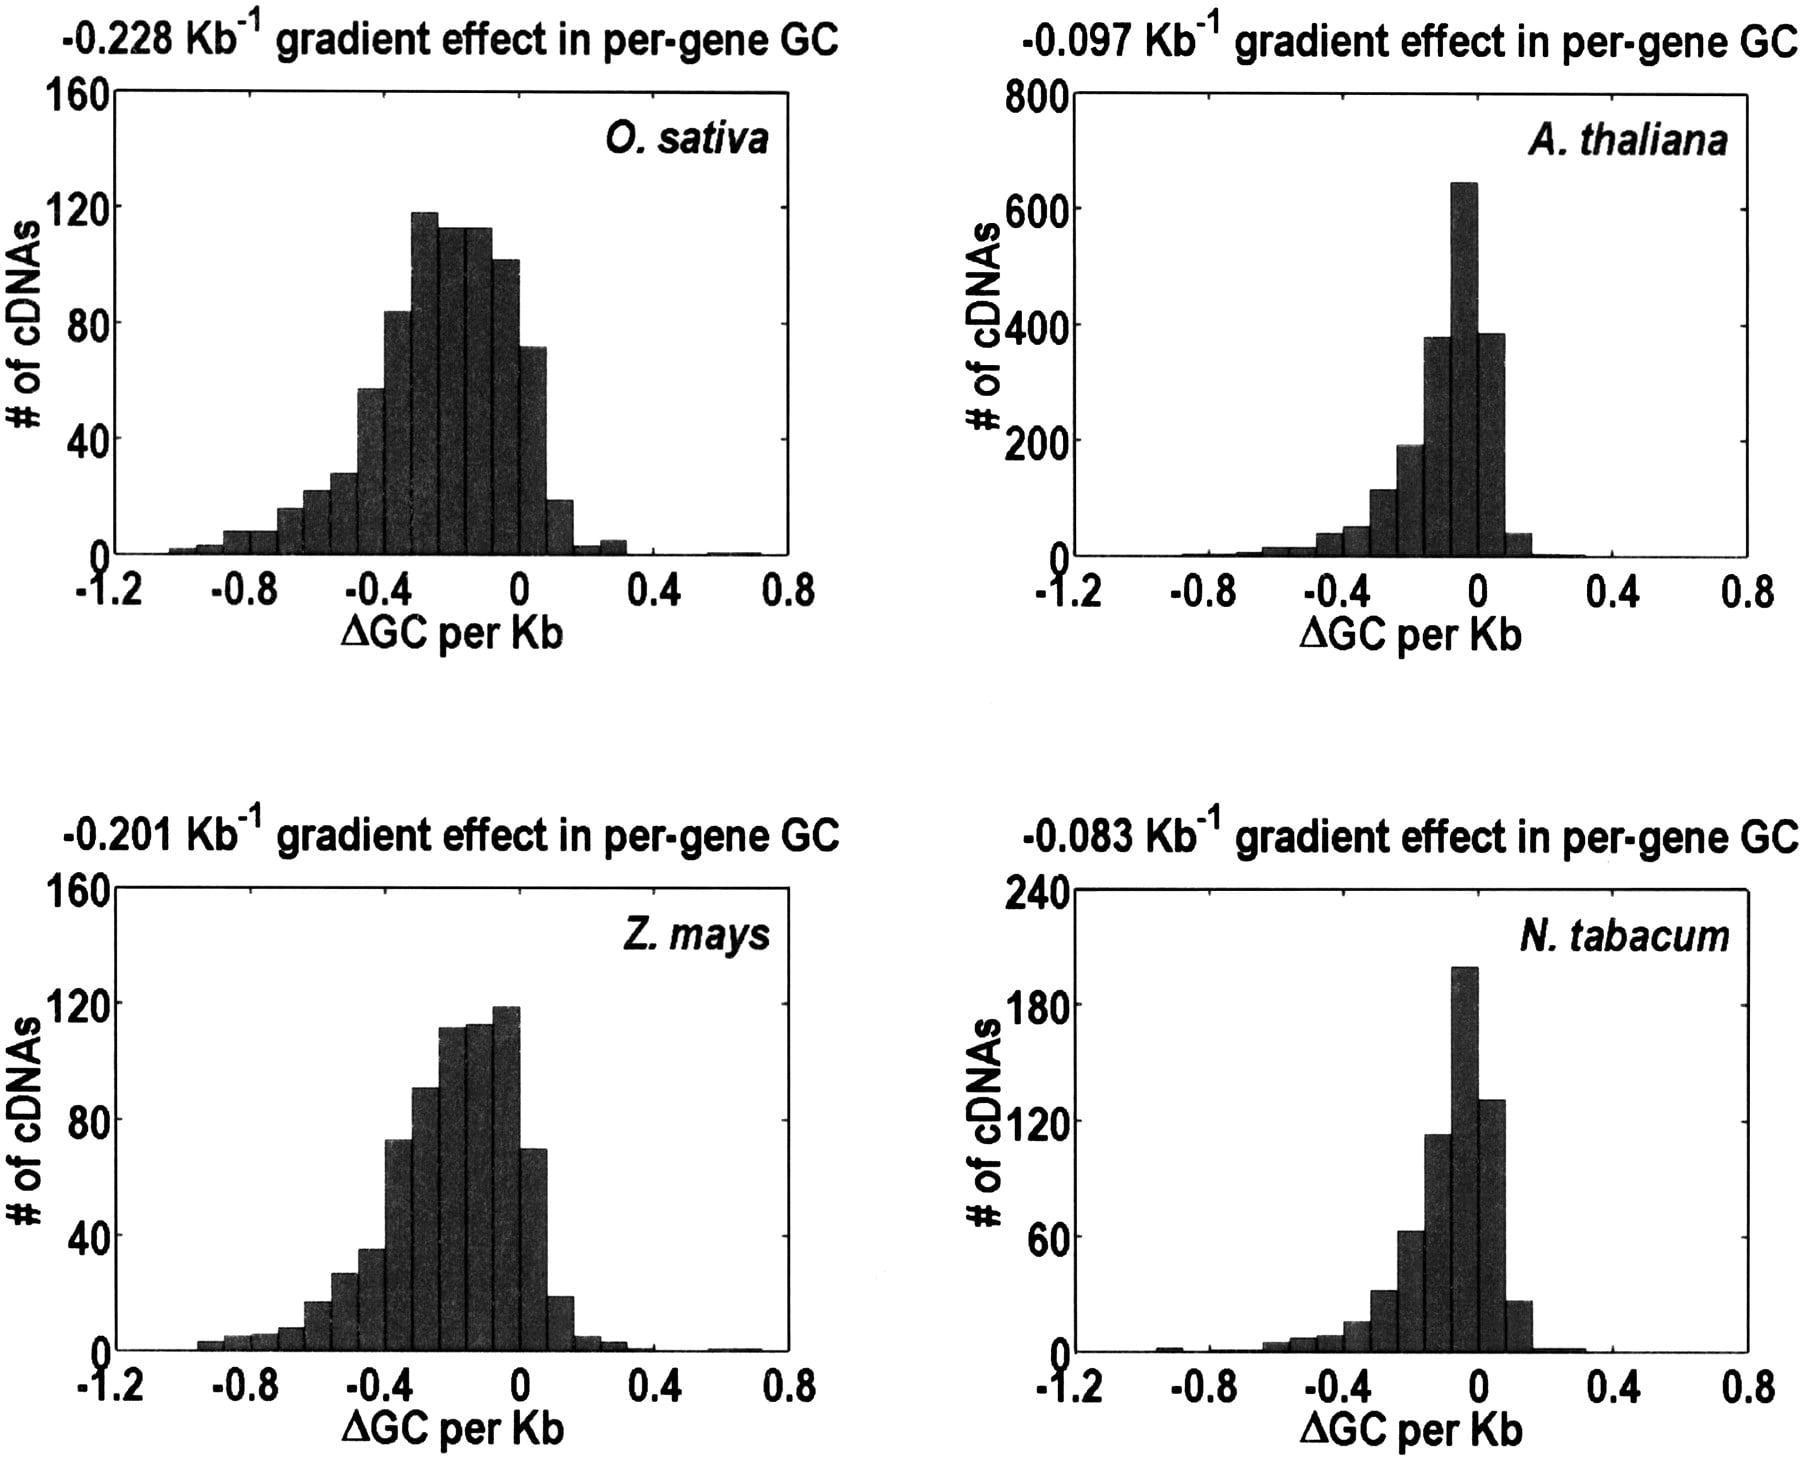
Figure 2.
Distributions for “per-gene” GC content gradients in O. sativa, Z. mays, A. thaliana, and N. tabacum. The gradient is the slope of the trend in GC content versus position, defined only for the first kilobase of the coding region, to respect the finite extent of the gradient effect.