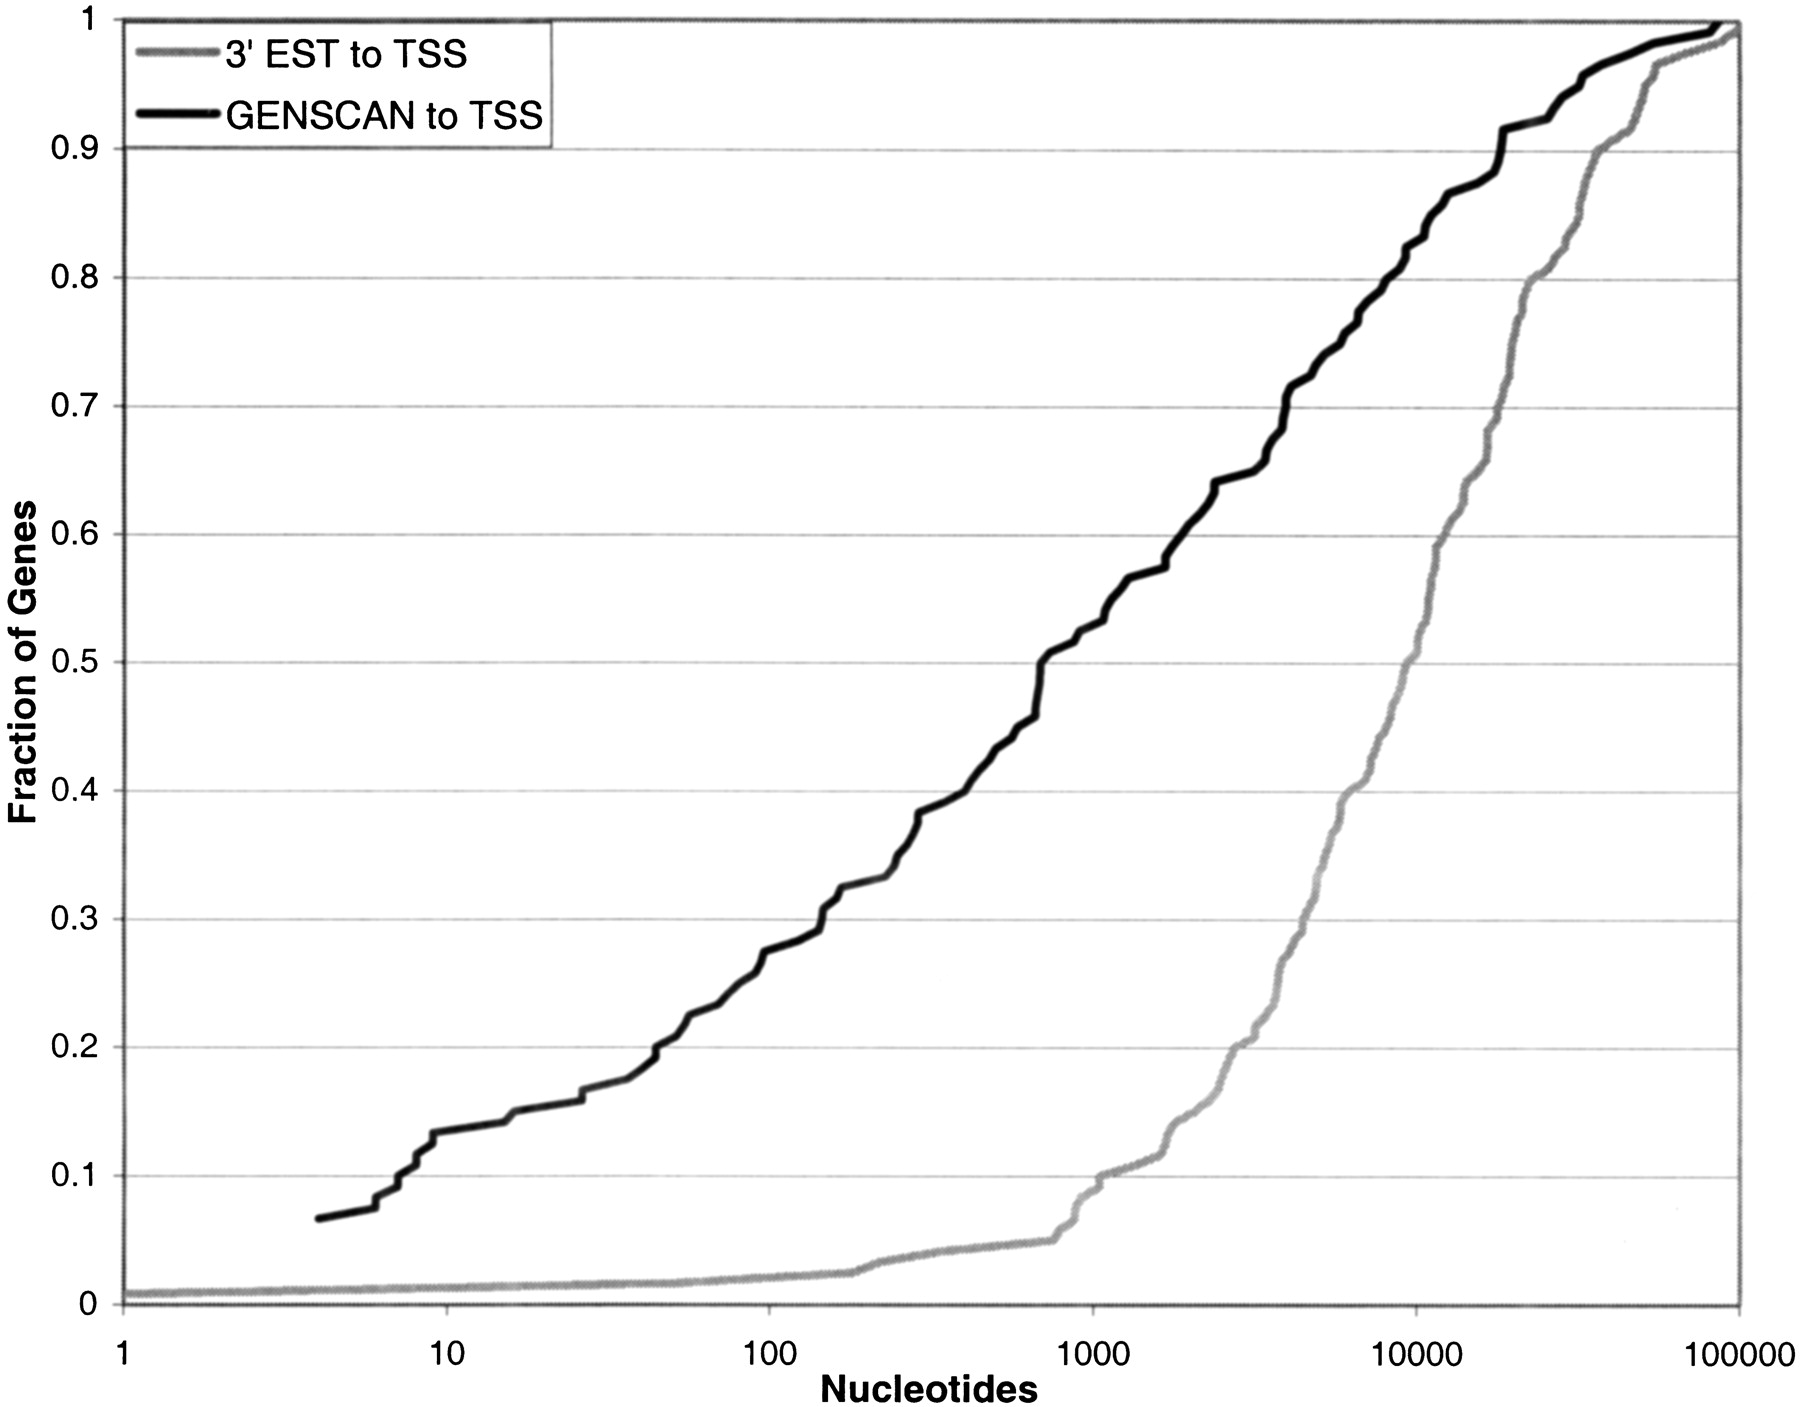
Figure 2.
Shown in the figure is the cumulative fraction of genes in the Suzuki120 test set as a function of the number of nucleotides in the genome from the true transcription start site (TSS) to the (dark line) 5′ most high-quality GENSCAN predicted exon or (gray line) 3′ expressed sequence tag (EST) match.