Figure 2.
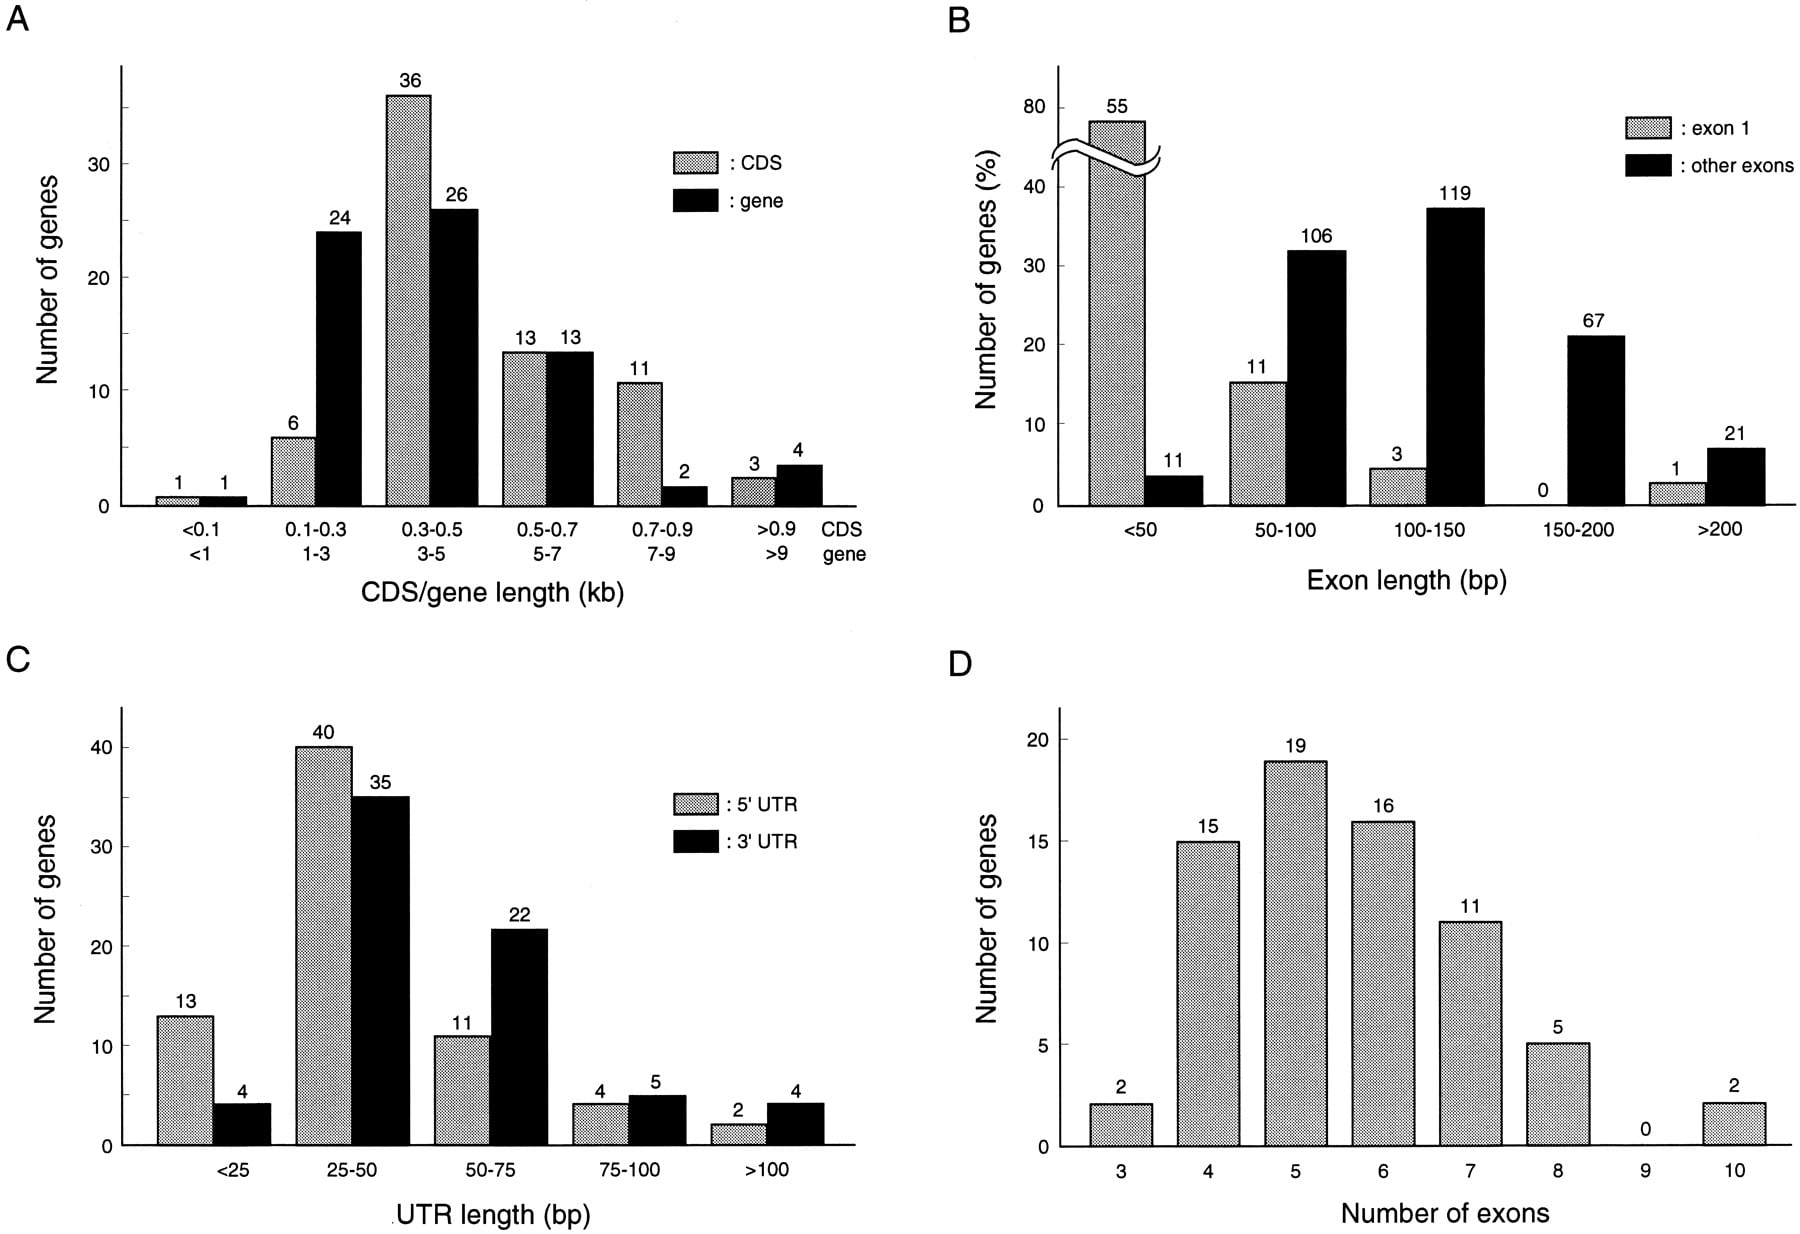
Distribution of RP gene features. Shown are size distributions of genes and CDSs (A), exons (B) and 5′-and 3′-UTRs (C), as well as the numbers of exons (D).
Distribution of RP gene features. Shown are size distributions of genes and CDSs (A), exons (B) and 5′-and 3′-UTRs (C), as well as the numbers of exons (D).