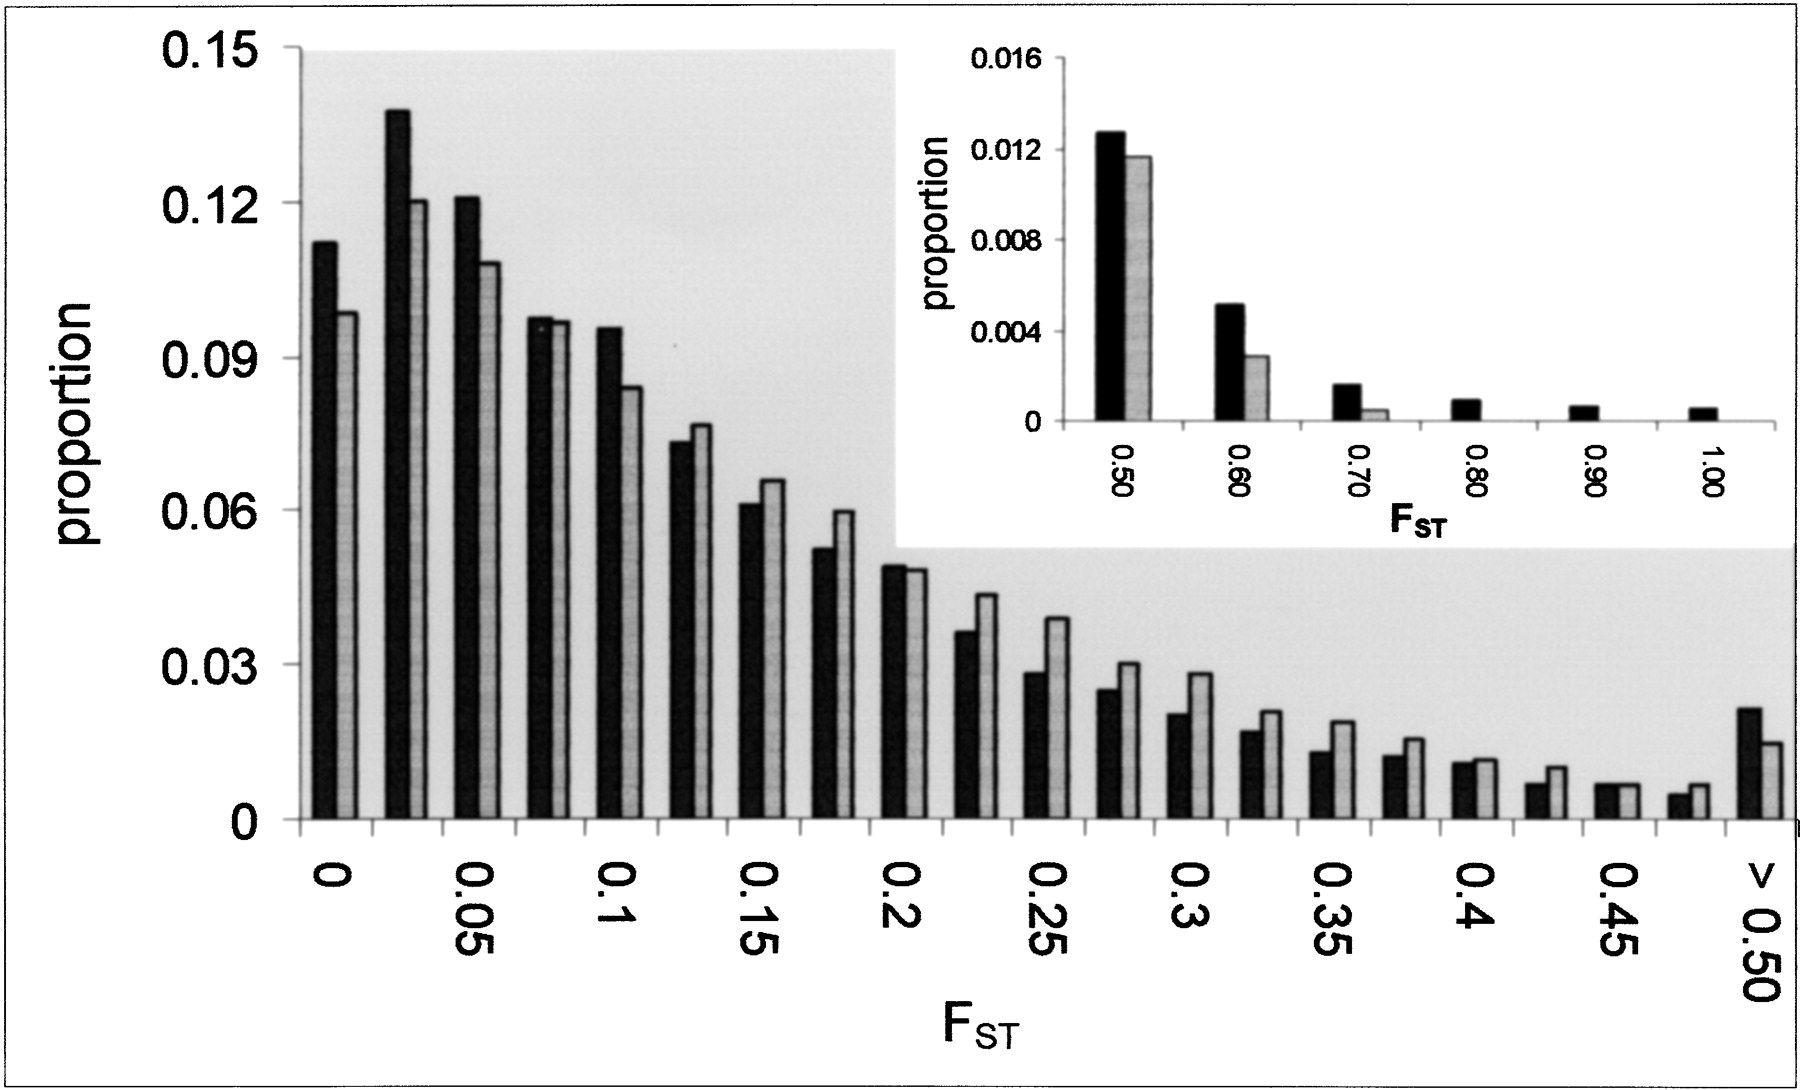
Figure 2.
Genome-wide distribution of FST. Solid bars show the observed distribution of FST for 25,549 autosomal SNPs. The X chromosome was not included in this analysis because it has a different effective population size compared with that of autosomal markers. Lightly shaded bars represent the simulated distribution of FST. The inset figure shows the observed and simulated distributions of FST for values ≥0.5.