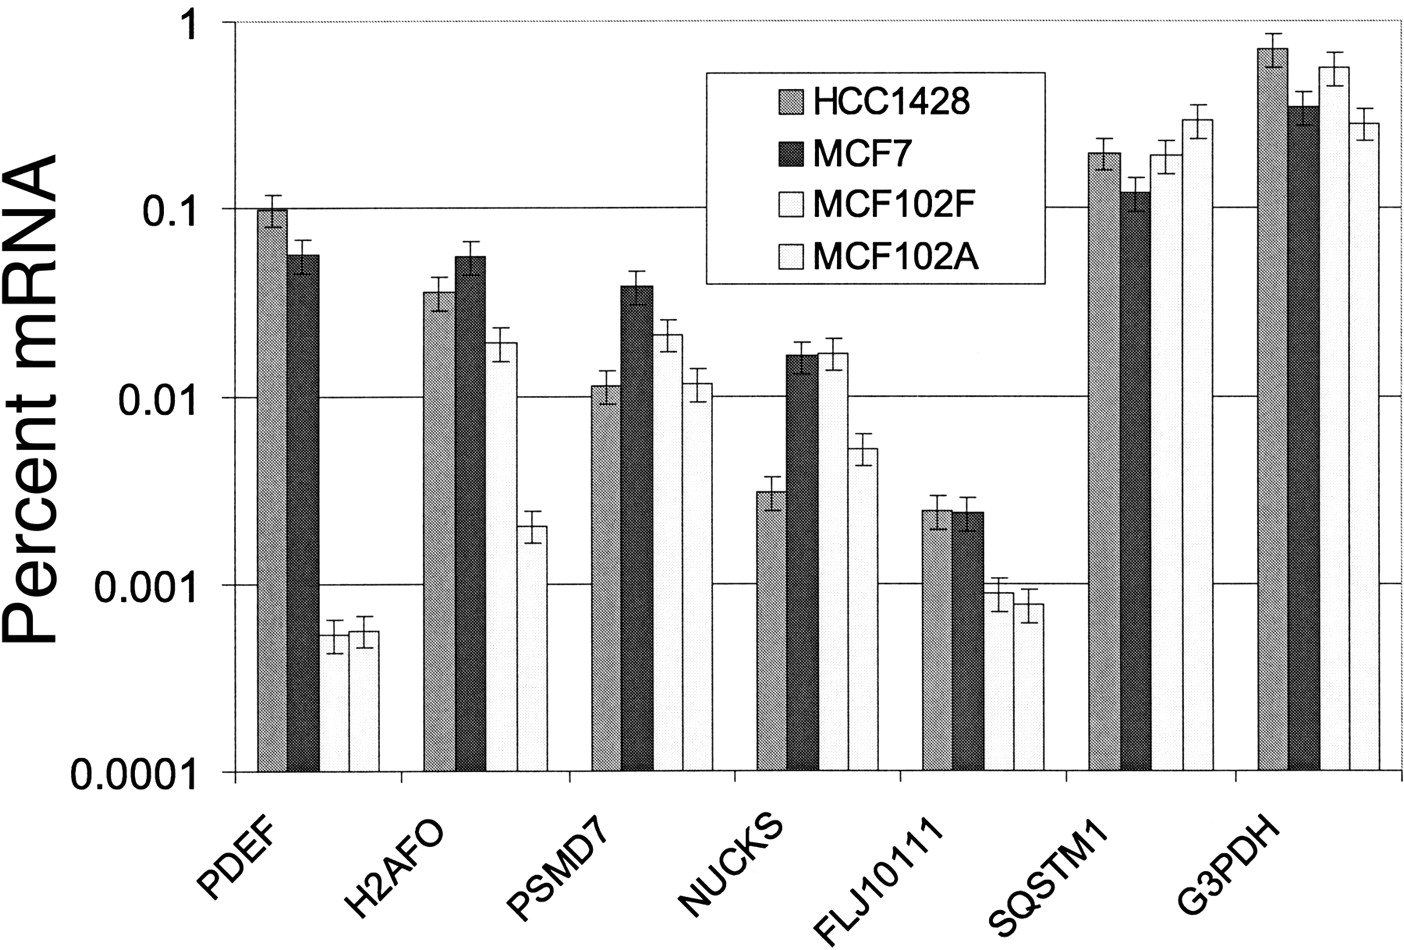
Real-time PCR data quantifying the levels of mRNA transcript for each indicated gene in four different cell lines.