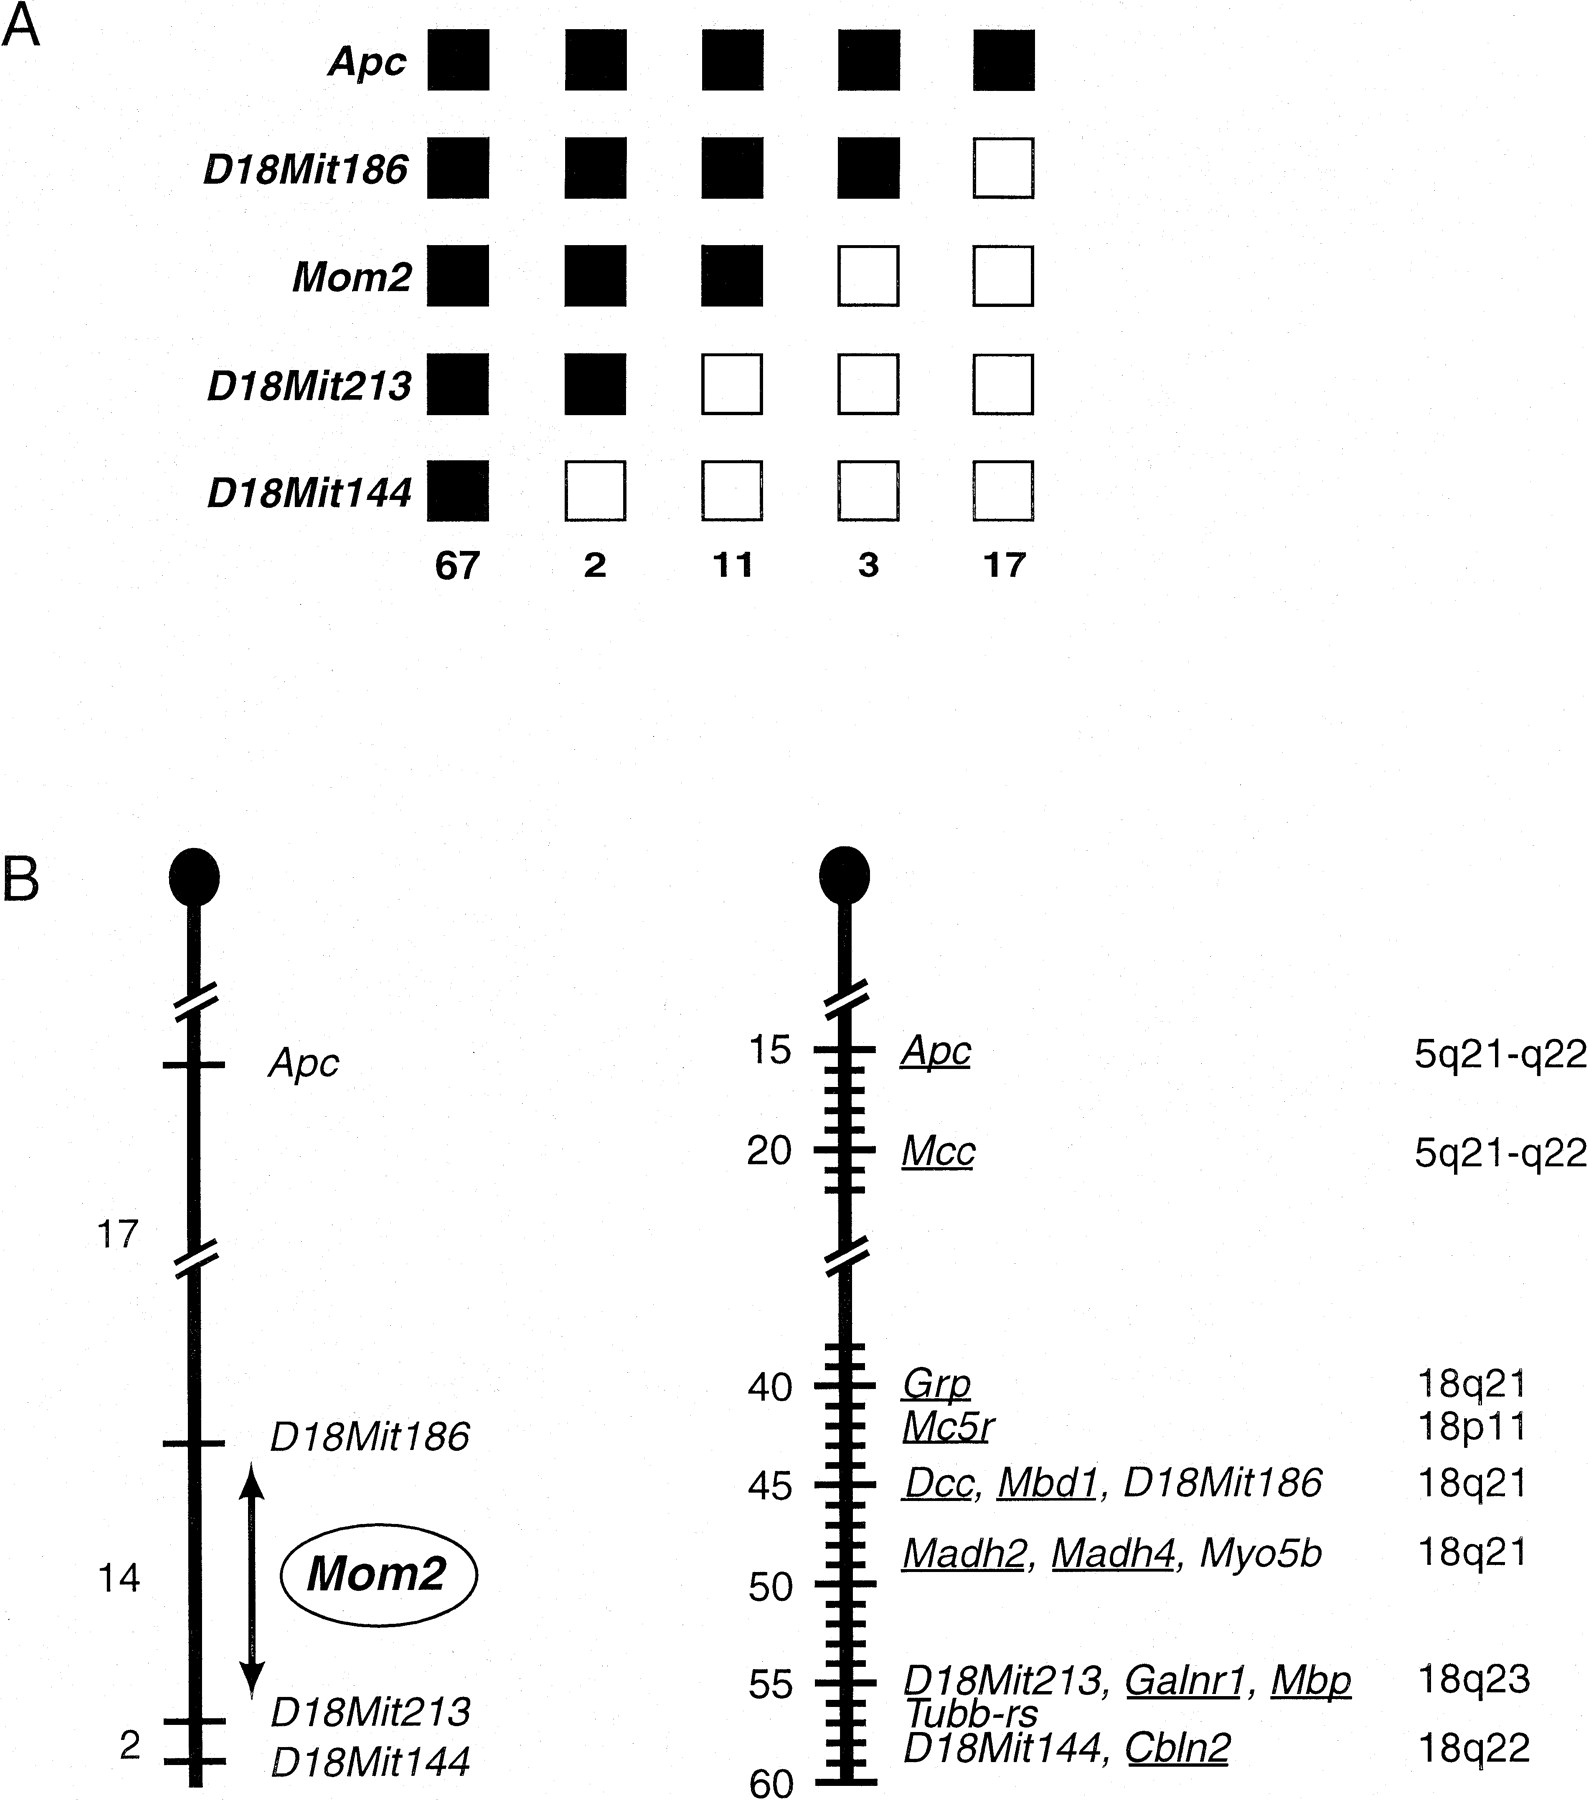
Mapping and chromosomal localization of the Mom2 locus in the mouse genome. (A) Summary of the results of the N2 backcross analysis. Loci mapped in the analysis are listed to theleft. Black boxes represent the C57BL/6J (B6) allele, and white boxes represent the DBA/2J (D2) allele. The Mom2 allele was determined by phenotype: black boxes represent the resistant B6 allele where mice had ≤24 polyps, and white boxes represent the susceptible (wild-type) D2 allele where mice had ≥25 polyps in the small intestine. The numbers of each type of chromosome identified in the backcross progeny are listed at the bottom. (B) Genetic localization of the Mom2 locus. The region of chromosome 18 analyzed in our backcrosses (left) is shown adjacent to a partial consensus linkage map of mouse chromosome 18 (Radice 2000). The loci mapped are listed to the right, and the genetic distances (in centimorgans) between adjacent loci are listed to theleft of the chromosomes. The two maps were arbitrarily aligned at the D18Mit186 and D18Mit213 loci. The data from our backcross analysis gives a genetic distance of 14 ± 3.5 cM between D18Mit186 and D18Mit213, whereas the genetic distance given in the consensus map shows the two loci as being 10 cM apart. The locations of the human homologues of mouse genes are listed to the right.