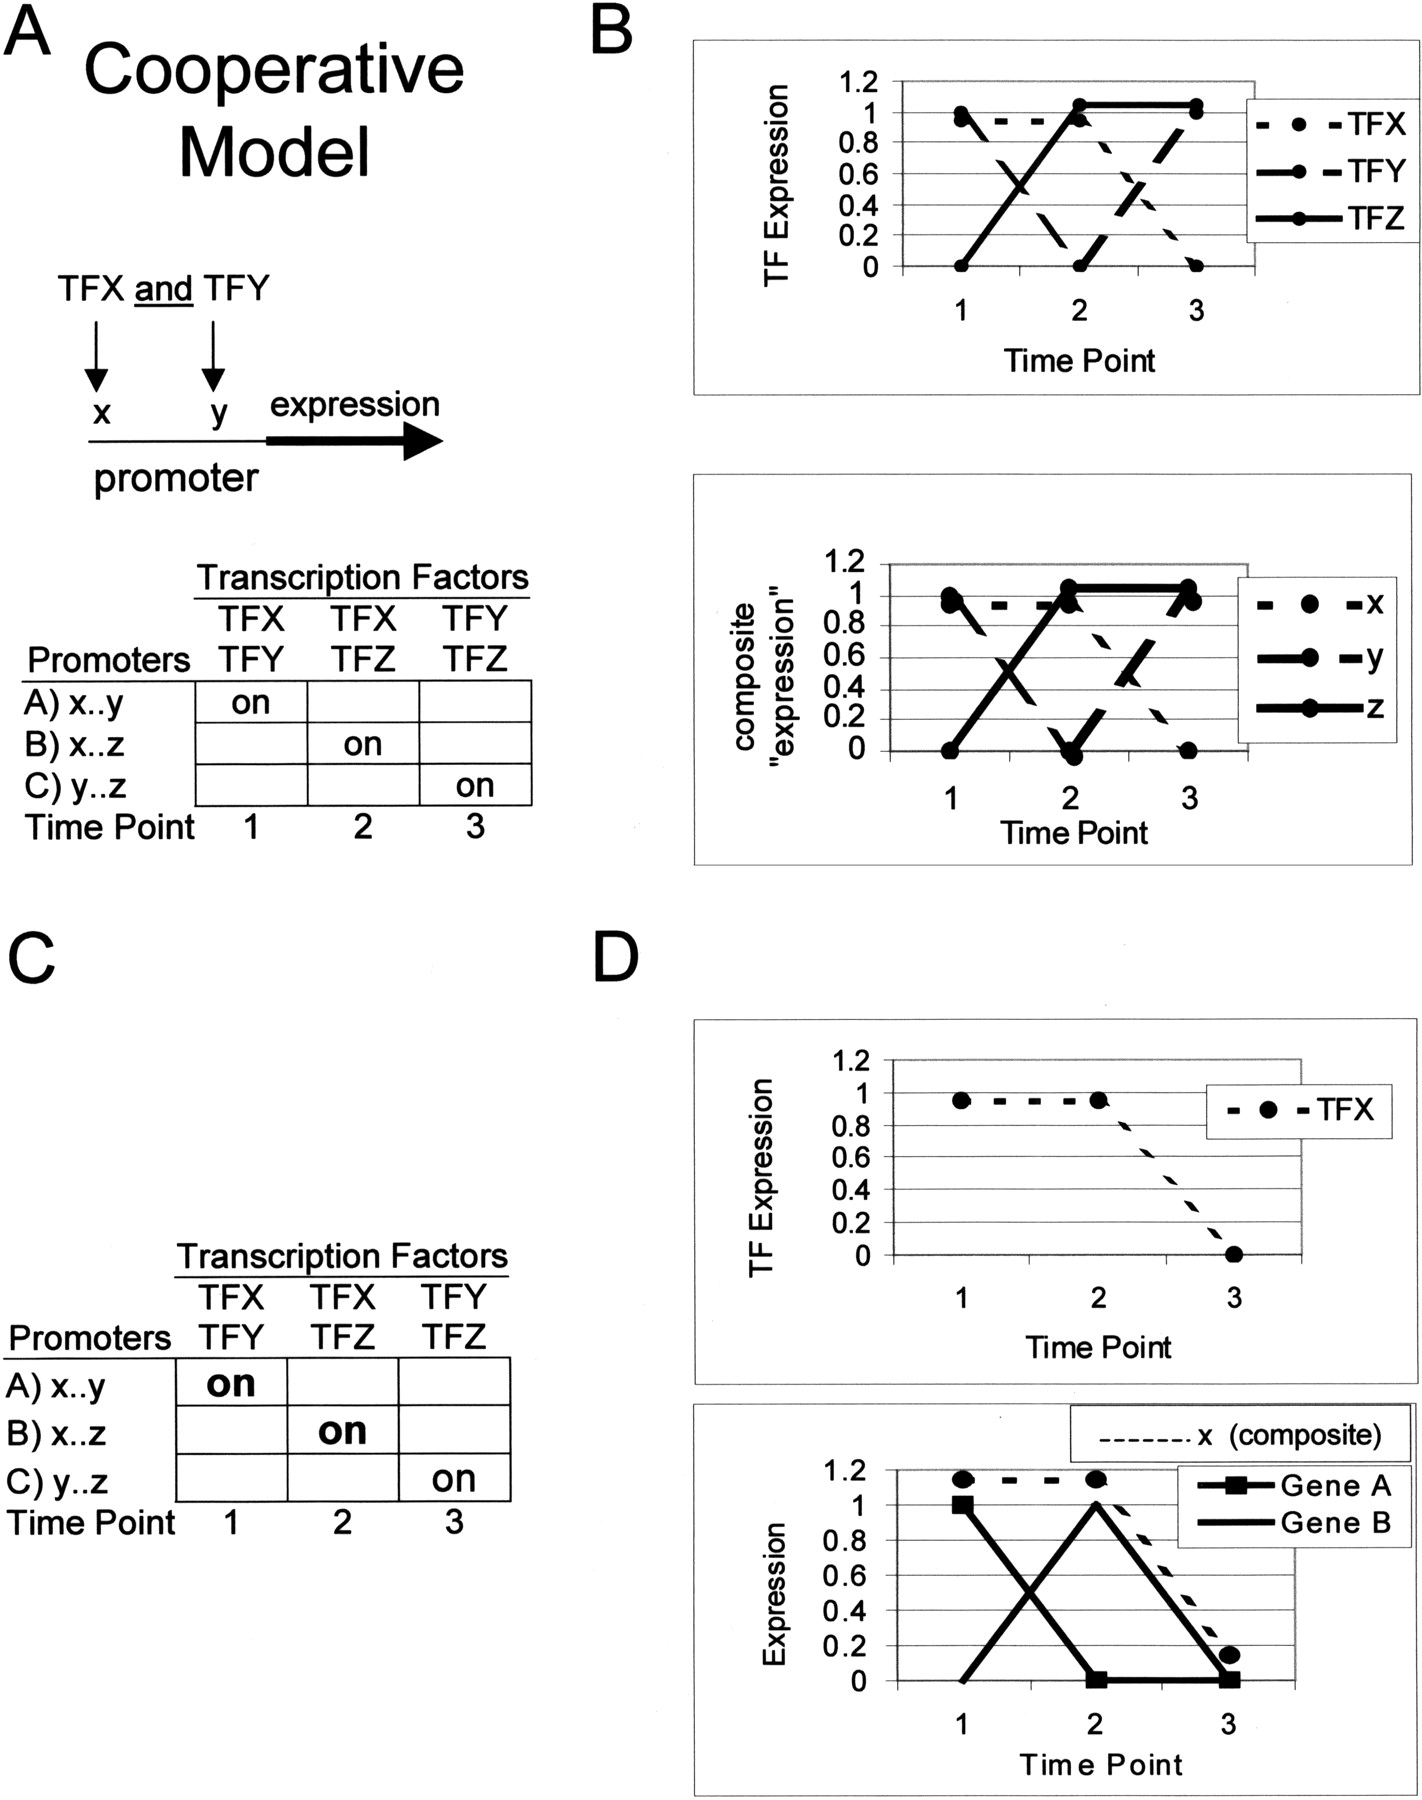
How the program operates under cooperative gene regulation in which two transcription factors binding to their respective cis elements are necessary to induce expression. (A) The top row in the table shows a hypothetical case in which different pairs of transcription factors are expressed at three time points. In the leftmost column are promoters containing the binding sites for transcription factors [e.g., transcription factor X (TFX) bindscis element x]. The internal cells illustrate gene expression patterns given expression of transcription factors and composition of gene promoters. (B) Expression patterns of the transcription factors (TFs; top) and the composite expression of genes grouped by the presence of cis elements in their promoters (x,y,z). A comparison of the top graph and the bottom graph shows that transcription factors correlate with composite patterns to reveal the correct binding relationships. (C,D) Breakdown of composite expression pattern construction. (C) A hypothetical case of cooperative binding as in A and B but with expression of genes with cis element x in bold. (D) Expression of TFX is in the top graph. The expression patterns of the two genes with cis element x are shown as solid lines in the bottom graph and their composite expression is the broken line immediately above. A comparison shows that TFX expression correlates with the composite expression of genes with cis element x in their promoter although TFX alone is not sufficient to induce expression.