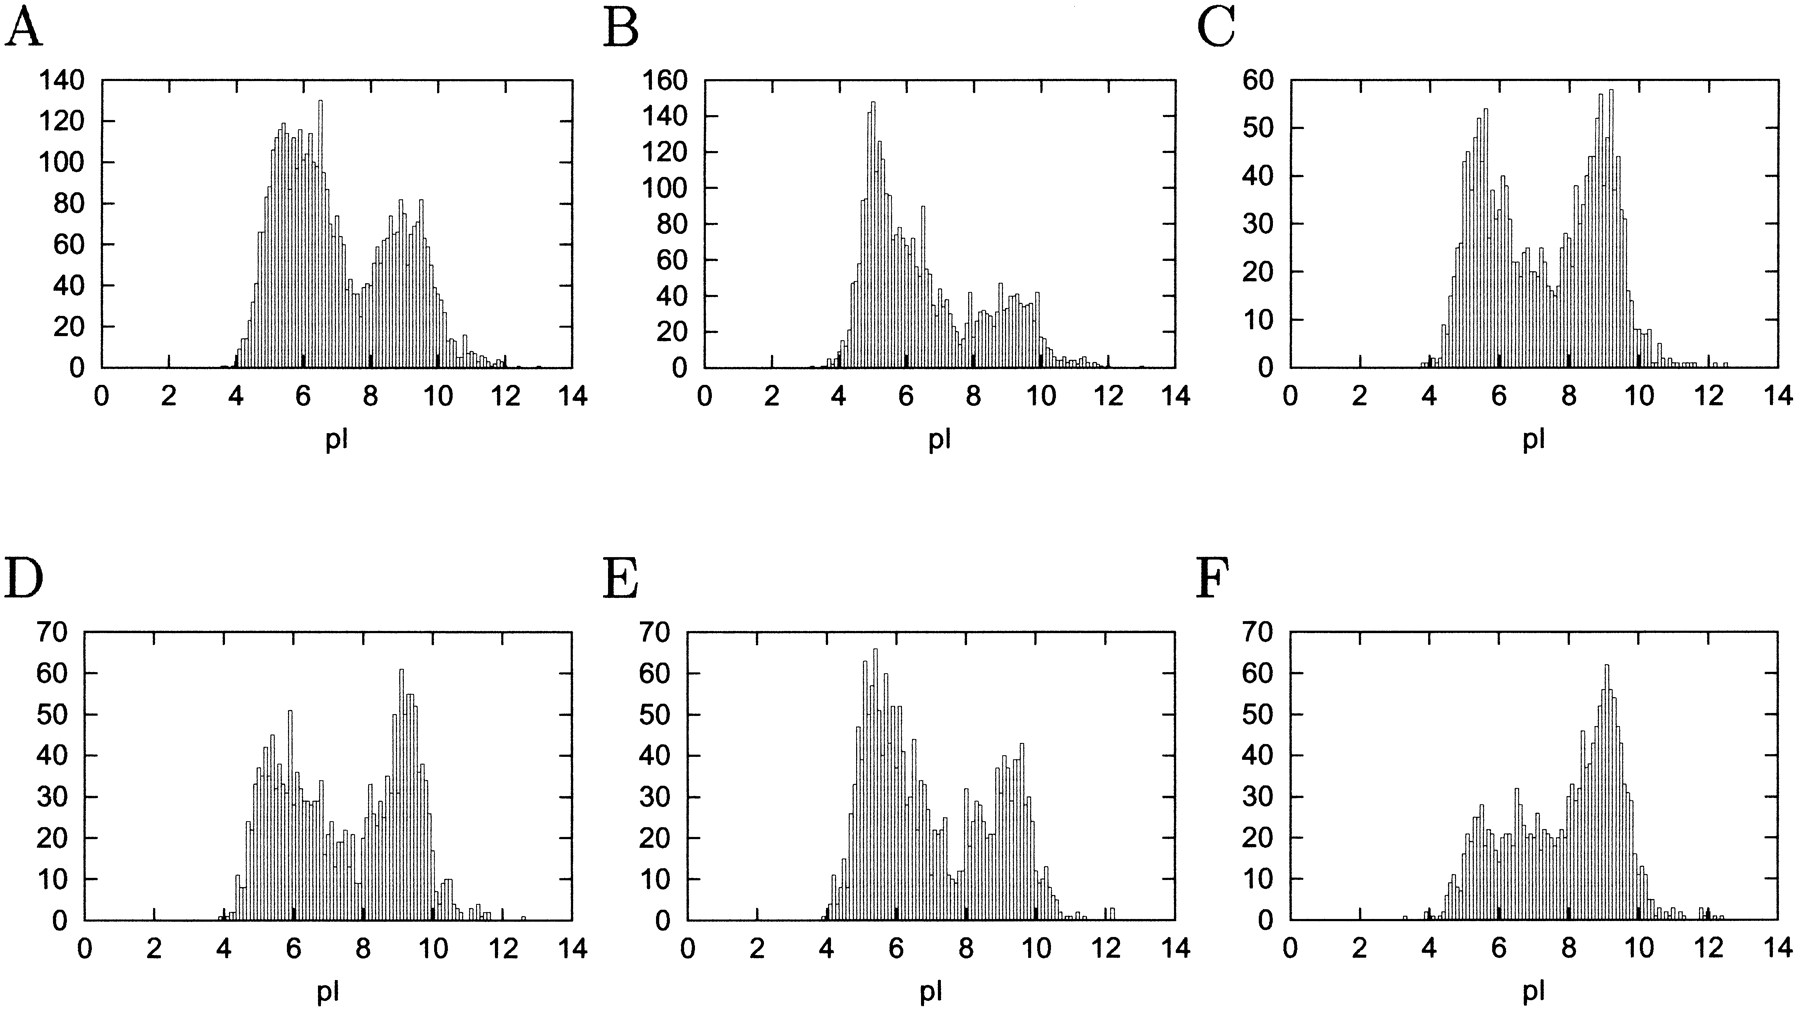
Figure 2.
Histograms of pI values at 0.1 unit intervals for (A)Escherichia coli K12–, (B) Synechocystissp. strain PCC 6803–, (C) Methanococcus jannaschii–, (D) Pyrococcus abyssi–, (E) Thermotoga maritima–, and (F)Helicobacter pylori–predicted ORFs.
Histograms of pI values at 0.1 unit intervals for (A)Escherichia coli K12–, (B) Synechocystissp. strain PCC 6803–, (C) Methanococcus jannaschii–, (D) Pyrococcus abyssi–, (E) Thermotoga maritima–, and (F)Helicobacter pylori–predicted ORFs.