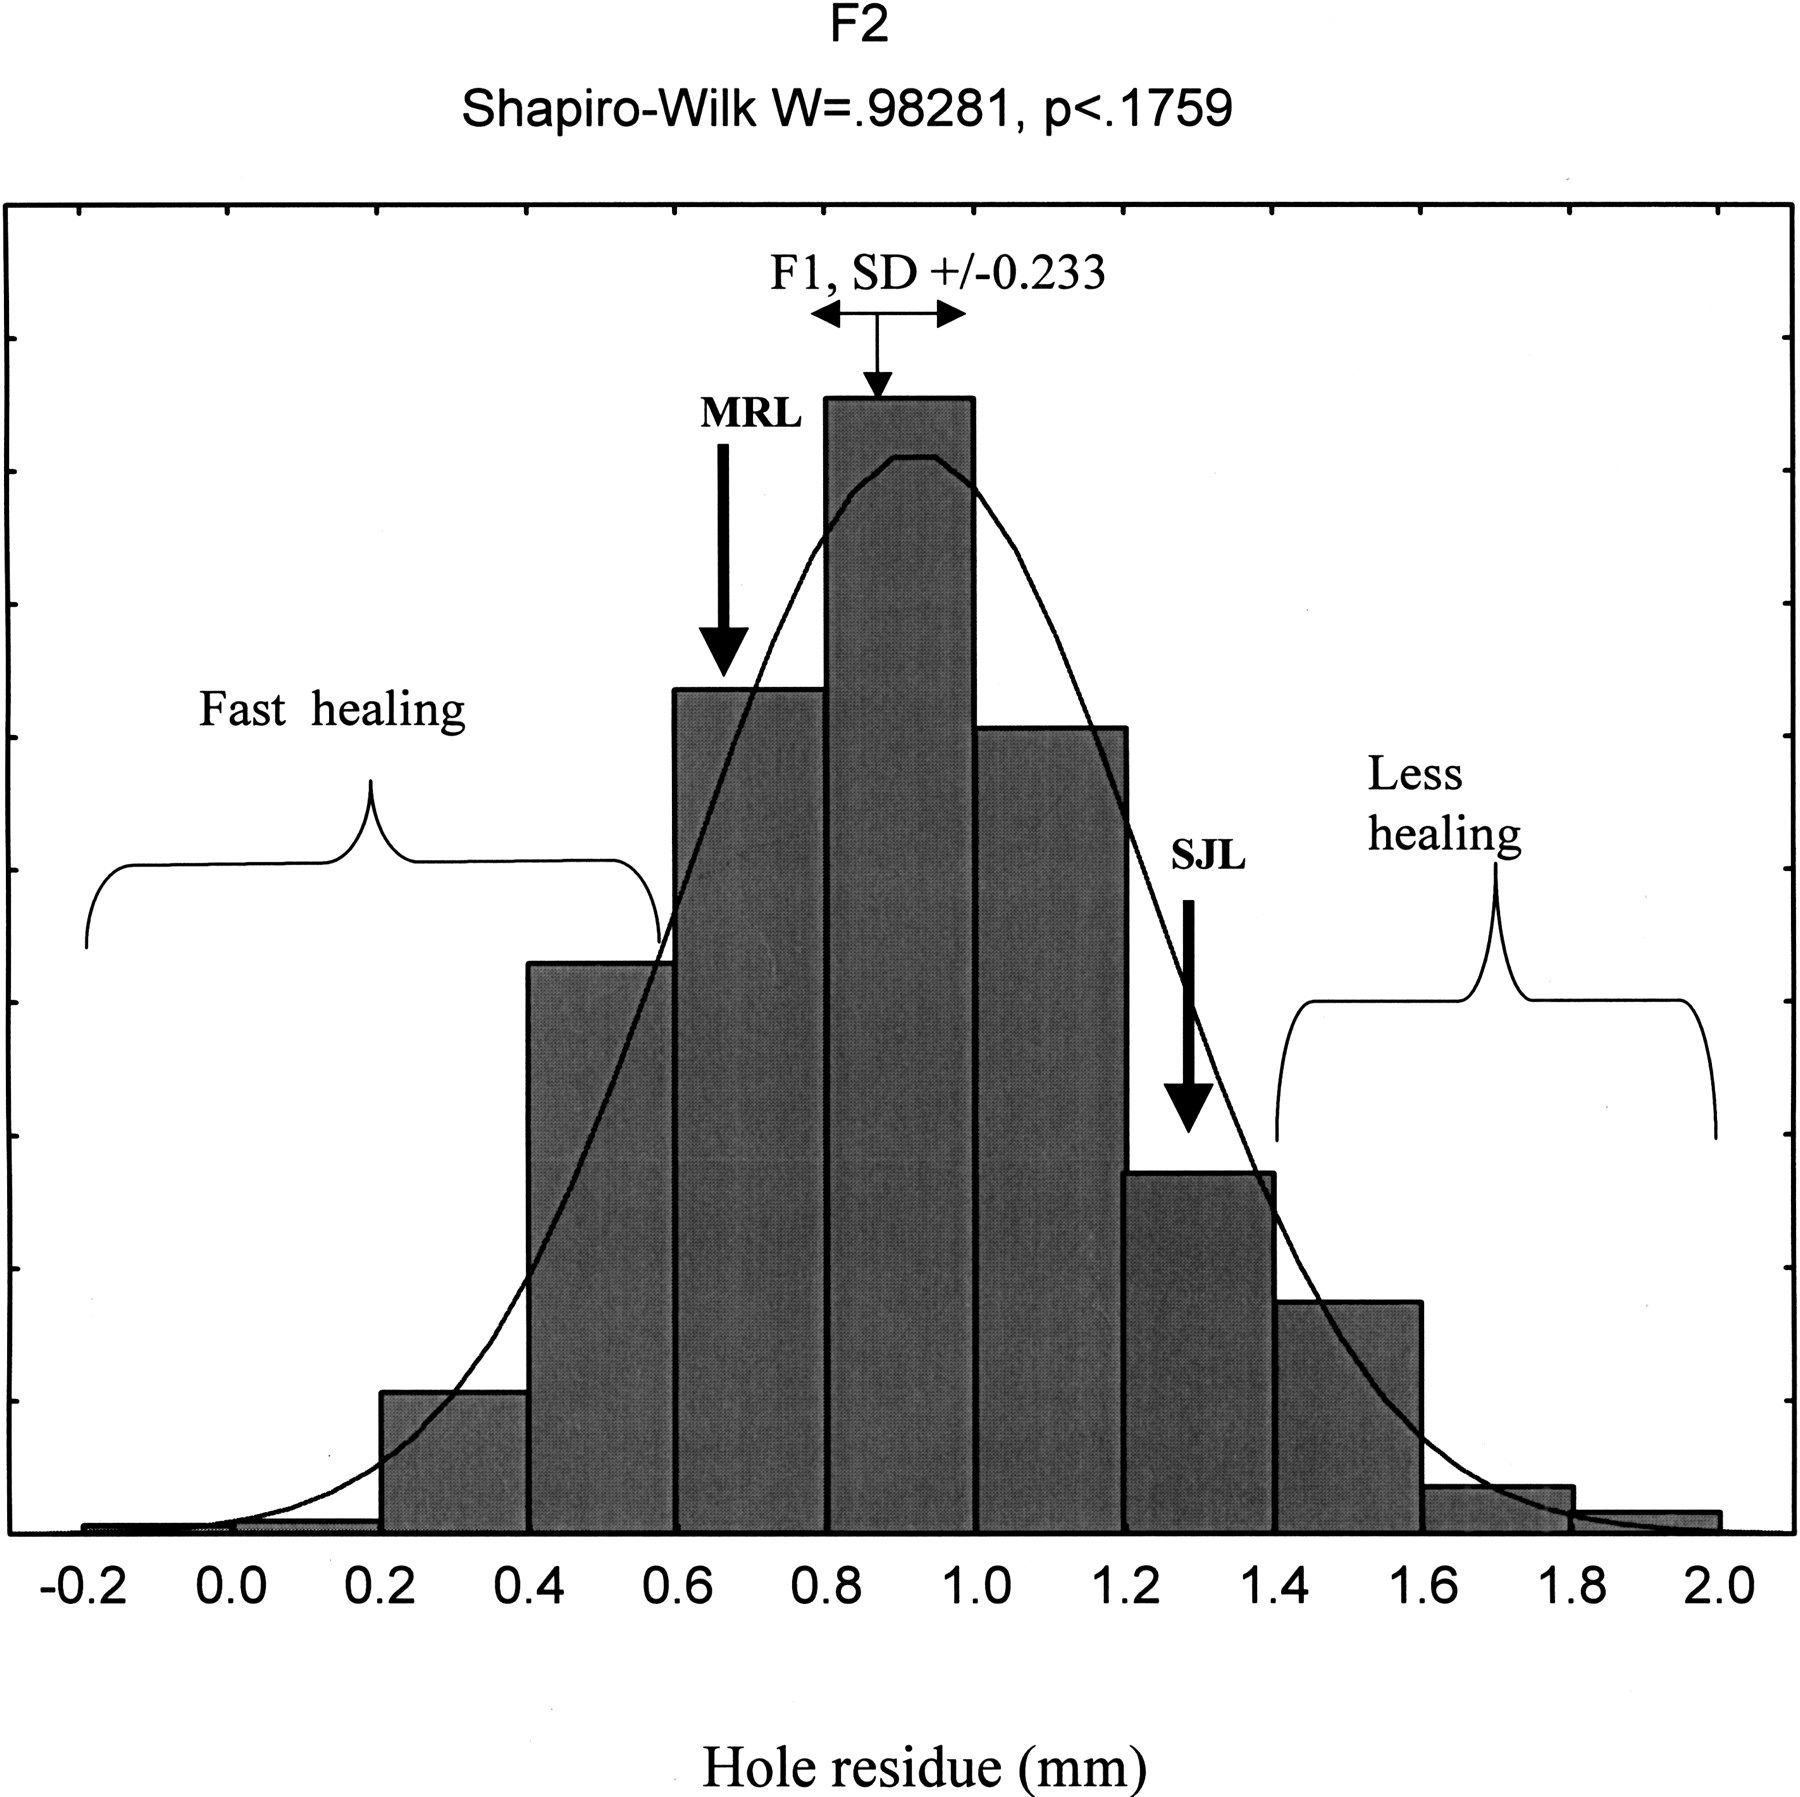
Figure 2.
The histogram of frequencies of the hole residue size on day 21 after wounding in F2 (MRL/MpJ × SJL) mice population. Arrows indicate F2 that heal better than MRL/MpJ and F2that heal worse than SJL/J progenitor mice. The Y-axis shows the number of observations, and the X-axis shows the hole residue in millimeters (mm).