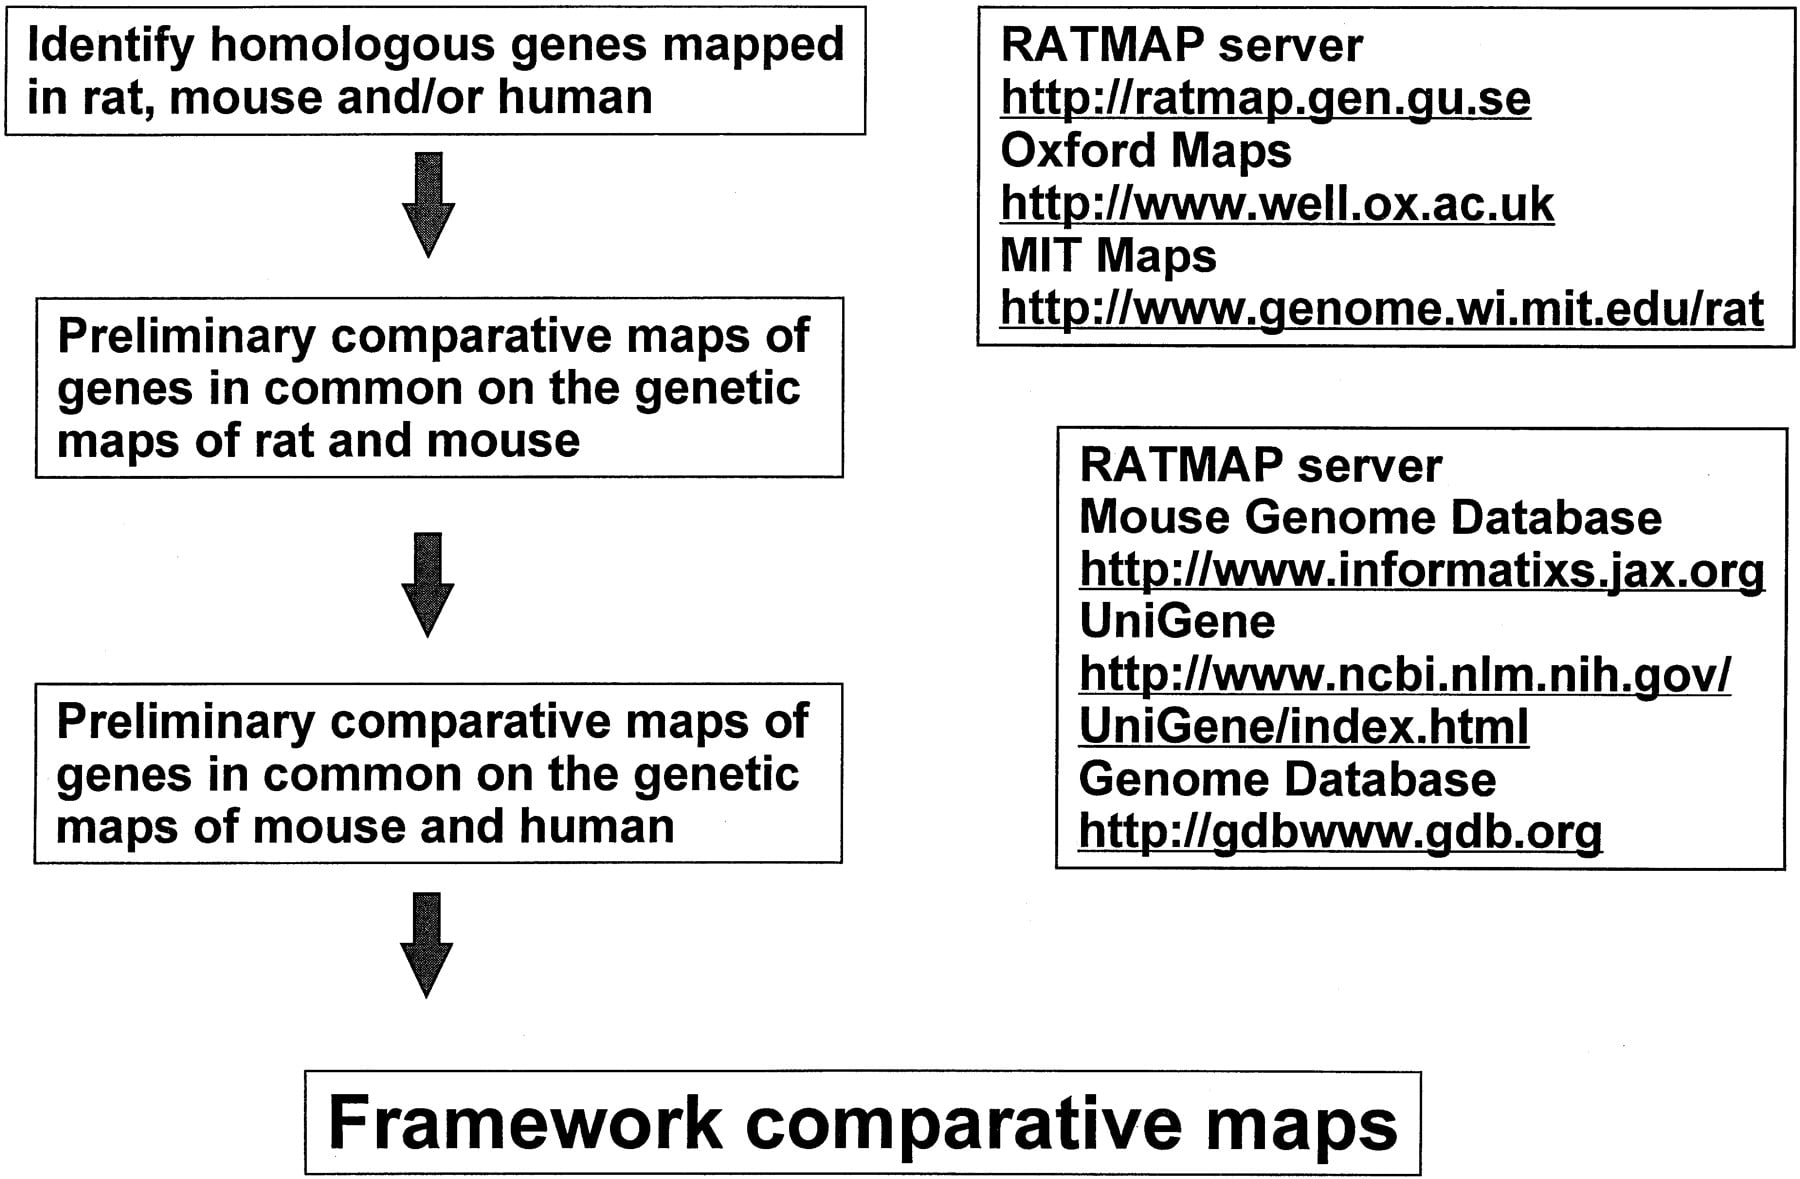
Figure 2.
Flow chart showing the algorithm for constructing framework comparative maps between rat, mouse, and human genomes based on publicly available databases.
Flow chart showing the algorithm for constructing framework comparative maps between rat, mouse, and human genomes based on publicly available databases.