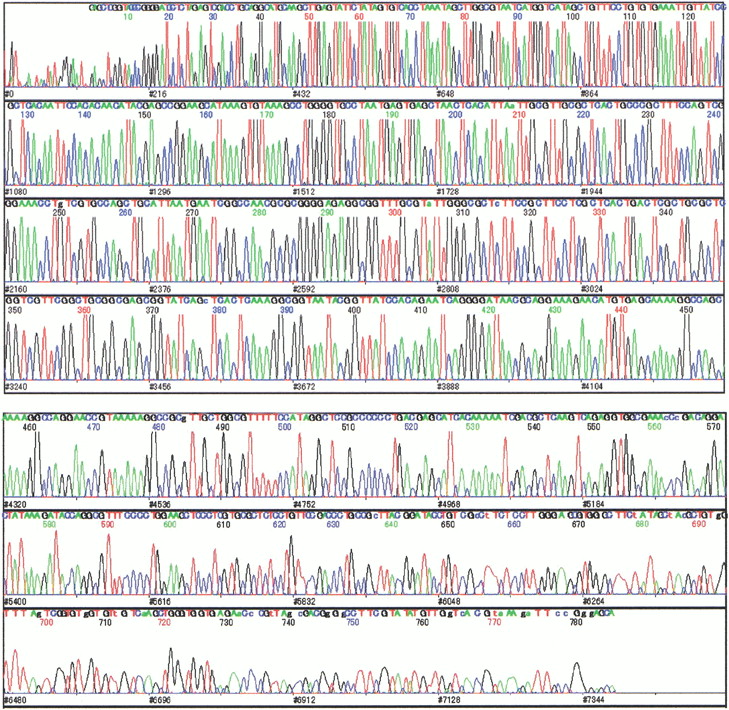
Figure 2.
Analyzed and base-called electropherogram. The horizontal axis represents the scan number and the vertical axis gives the relative amplitude.
Analyzed and base-called electropherogram. The horizontal axis represents the scan number and the vertical axis gives the relative amplitude.