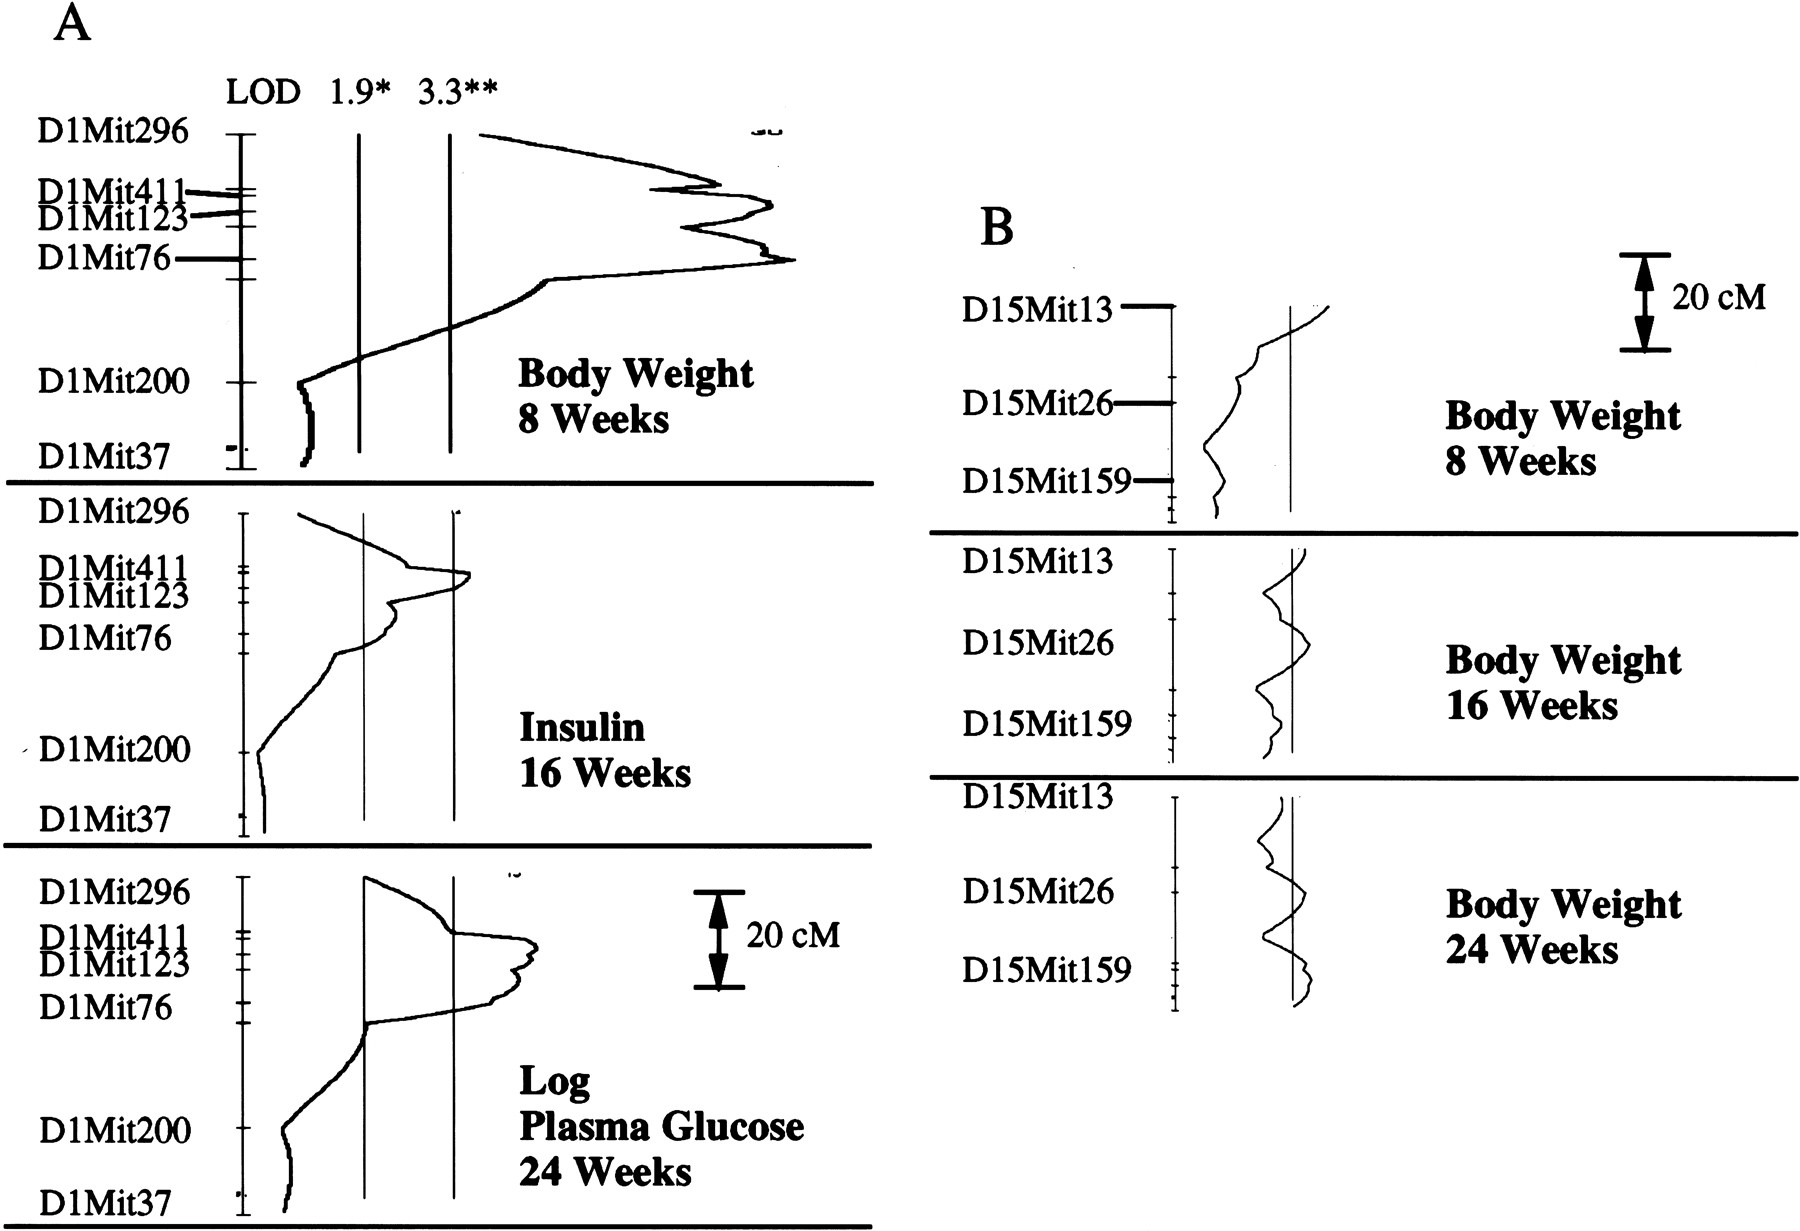
Complexity of QTL (Quantitative Trait Loci) on chromosomes 1 and 15. (A) The peak of the QTL for BW (Body Weight) and PG (Plasma Glucose) on chromosome 1 spans a 14-cM region that probably consists of two separate but equal peaks marked by D1Mit411 andD1Mit76. For plasma insulin, the peak is much stronger forD1Mit411, although there is a distinct shoulder marked byD1Mit76. (B) Three separate loci on chromosome 15 show a suggestive effect on BW at progressive time points. The locus marked by D15Mit13 is only associated with early BW and thus probably a growth modifier. The locus marked by D15Mit26, 20 cM distal, is associated with later BW, gain, body mass index, and leptin, suggesting that it could be an adipocyte growth modifier. The third locus, another 20 cM distal, and marked by D15Mit159, is suggestively associated with late BW gain and significantly associated with PG. (LOD) logarithm of odds; (*) threshold for suggestive QTL; (**) threshold for significant QTL.