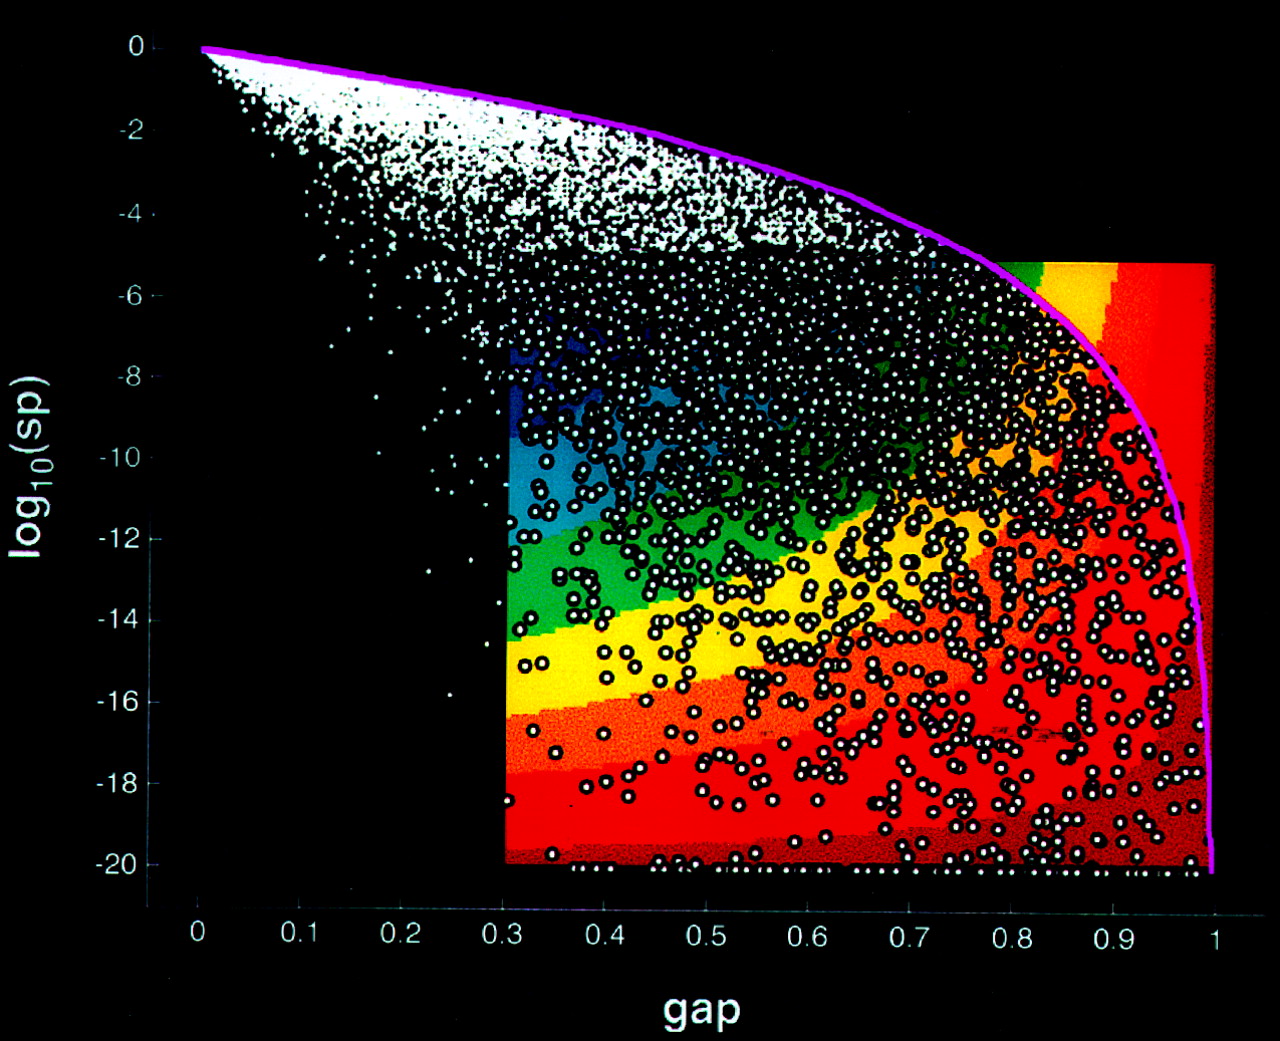
Selective expression in large-scale data. Results of the algorithm applied to a large database of assembly expression data are indicated. Each assembly is plotted as a point according to its gap (equation 3) and statistical significance log (sp adjusted) (equation 11). Those assemblies identified by the algorithm as being selectively expressed are plotted using bubble symbols. When these assemblies’ gap and log(sp adjusted) are transformed using equations 13 and 14, respectively, the resulting (g,s) fall within the (g,s)-unit square; hence, these assemblies are selectively expressed. The area enclosed by the rectangular region bounded byg thresh ≤ gap ≤ 1,g thresh = 0.3, on the abscissa and by −20 ≤ log10(sp adjusted) ≤ −5 on the ordinate is colored using a conventional spectrum. The coloring is according to the confidence of selective expression, i.e., the strength of the decision function d(g,s) (equation 15) corresponding to [gap, log(sp)] within the rectangle. The confidence (d) color coding is blue for low, yellow–orange for moderate, and red for high. The red region directs the eye to the assemblies with the strongest confidence of selective expression. However, those assemblies identified by the algorithm as being not selectively expressed, i.e., not meeting the minimum gap criterion or not meeting the minimum statistical significance criterion [log10(sp)thresh = −5], are plotted as solid dots in [gap,log(sp)] coordinates. These gap and log(sp adjusted), when transformed by equations 13 and 14, fall outside the (g,s)-unit square, hence, to the left or above the colored rectangular region ingap,log(sp)]-space. The weakest possible statistical significance as a function of gap is the curve plotted in magenta. This upper-bound curve represents log(sp) (equation 6) when the number of intensities equals the minimum number of sources criterion, namely n = 10, wherexn − x 1 is as large as possible, i.e., 1; hence, τ = gap (equation 4).