Skip to main content
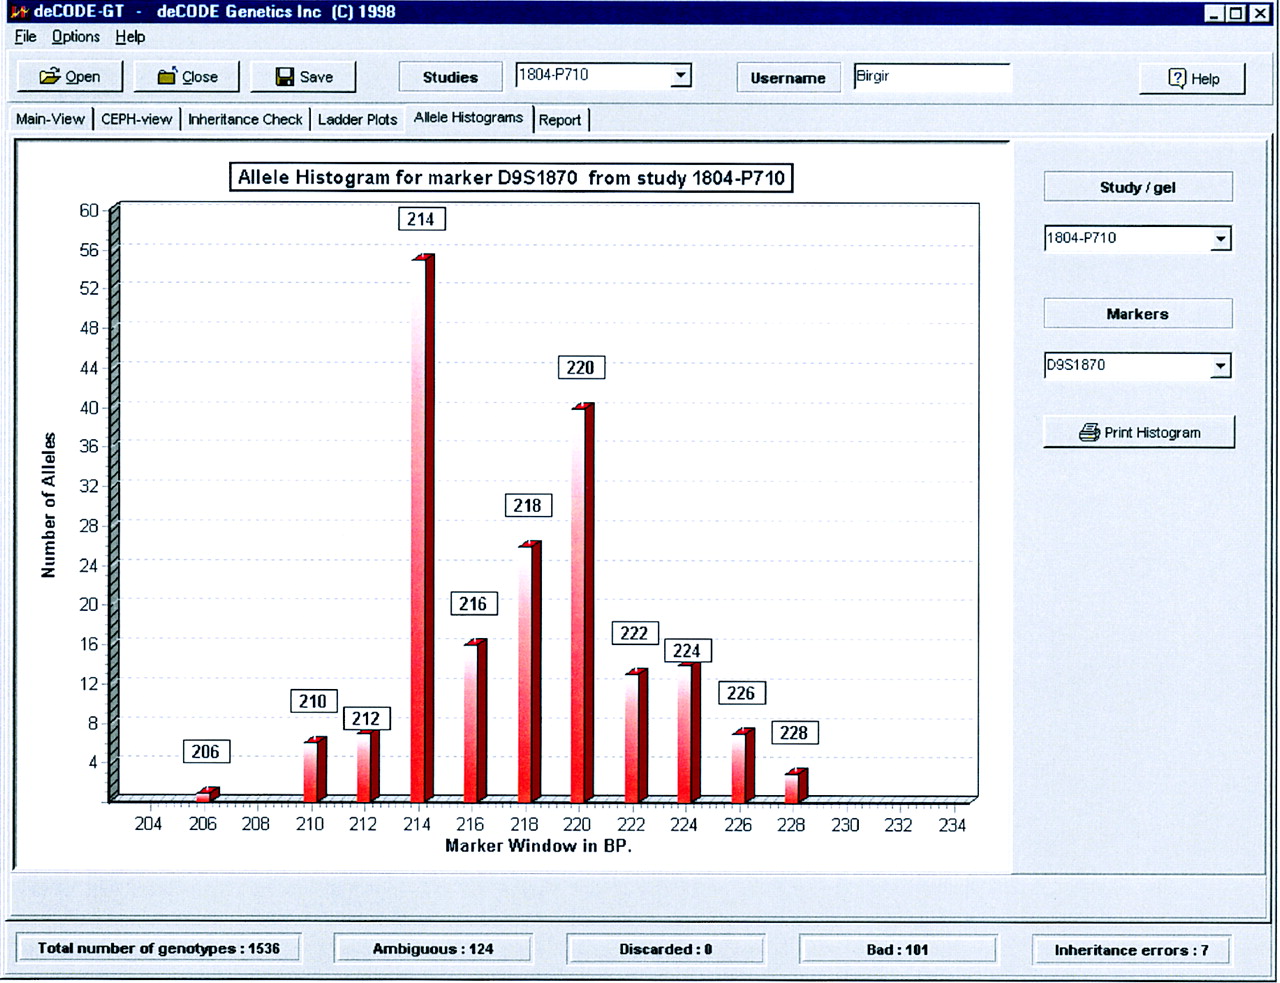
Figure 10.
The allele histogram view shows the allele distribution for selected markers.