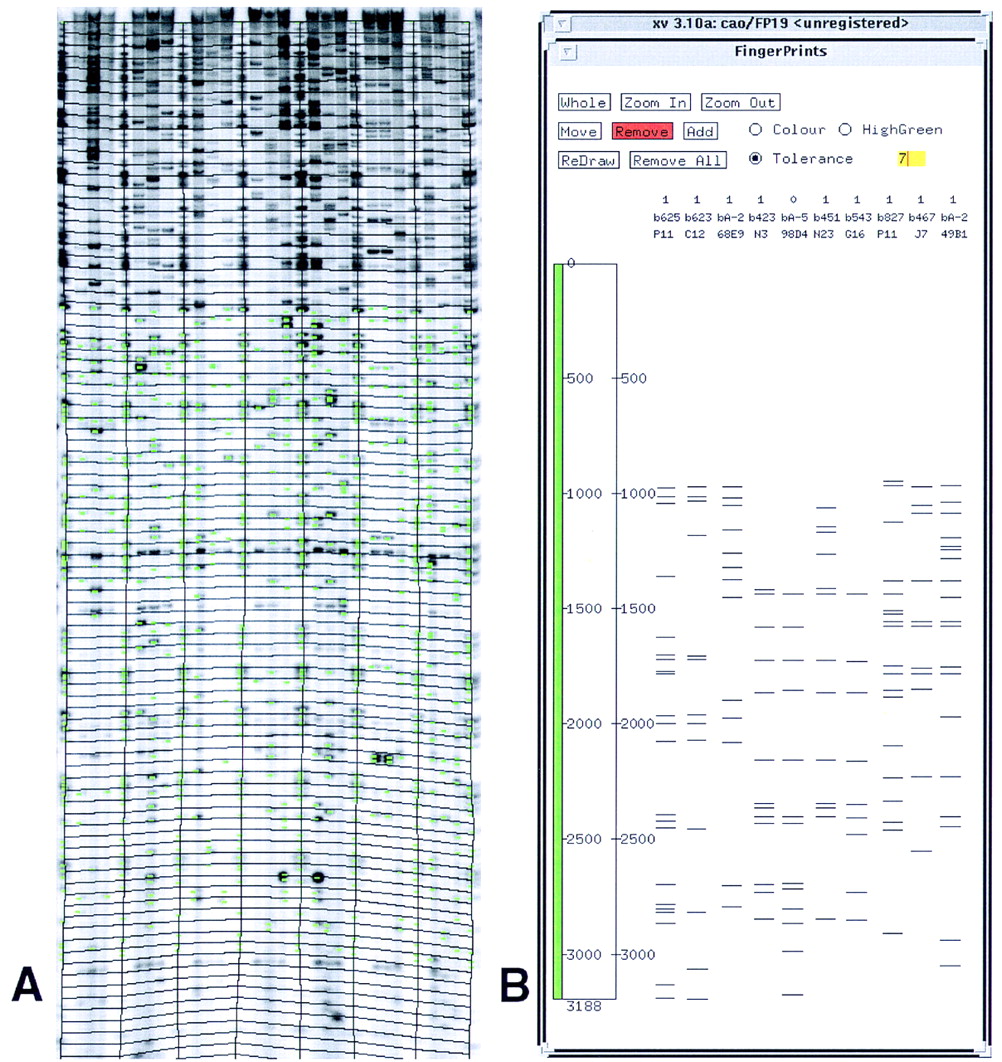
Figure 1.
(A) An example of a digitized restriction fingerprint gel image obtained from a polyacrylamide-based slab gel. Image-2.1 was used for the analysis of the gel. Green lines superimposed on the gel image correspond to the gel bands (bars) detected by the software. (B) FPC-2.5 was used for the analysis and comparison of restriction fragment patterns.