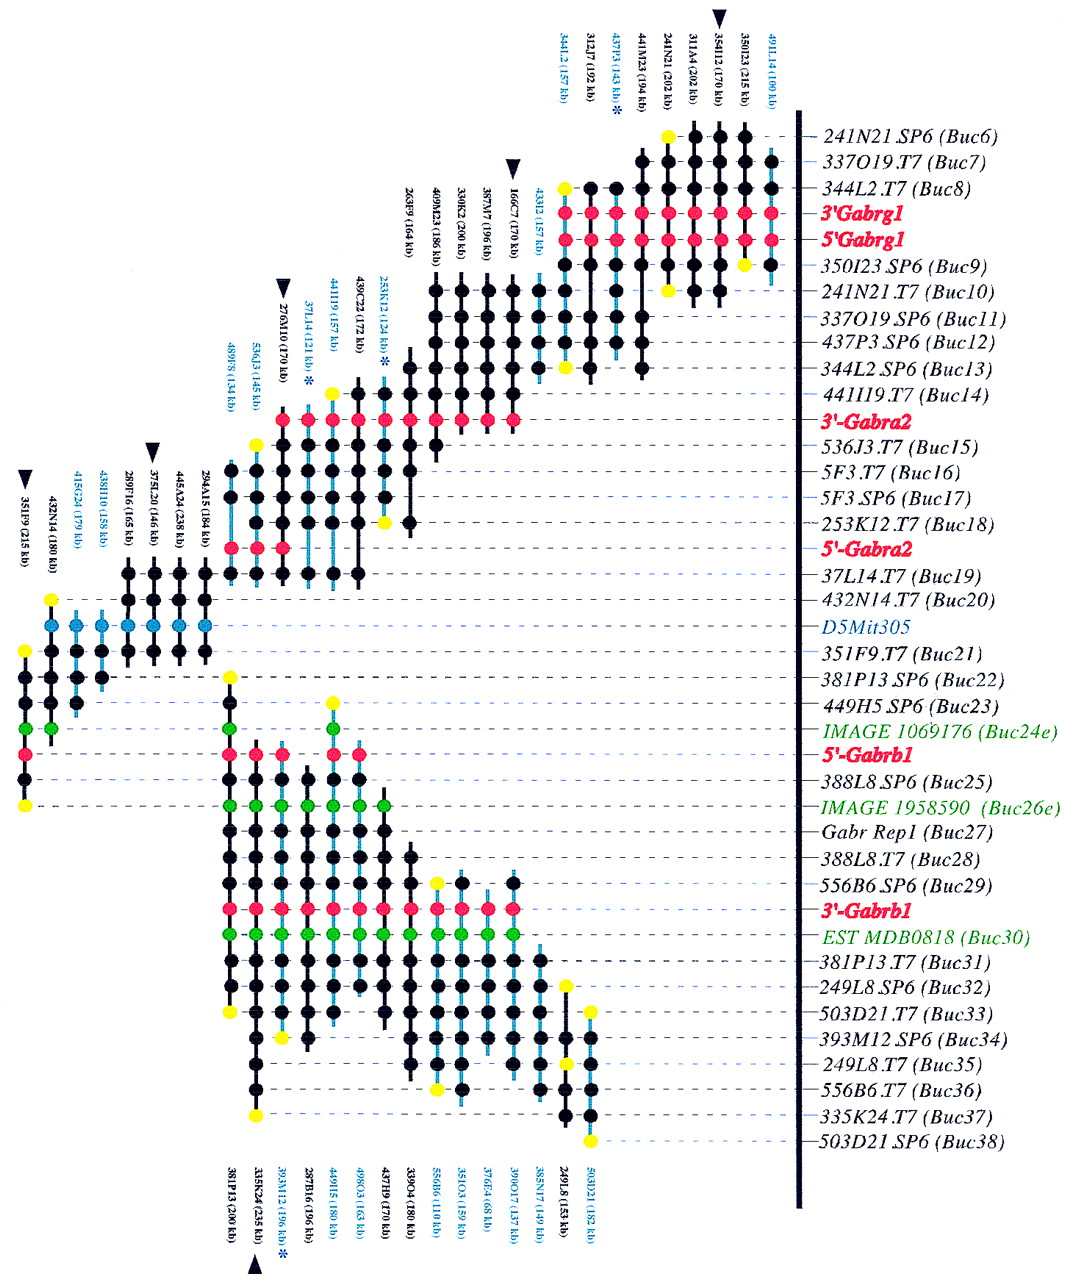
A BAC-based STS/EST-content map of the Gabr gene cluster on mouse chromosome 5 (oriented with centromeric end at left and telomeric end at right). The relative positions of mapped STSs and ESTs are indicated at top, including the corresponding loci names (D5Buc). The isolated BAC clones are shown as horizontal lines with circles along the lines indicating positive STS hits. The STSs were developed from BAC insert ends (black), known genes (red), ESTs (green), and an SSLP marker D5Mit305 (blue). When an STS corresponds to a clone insert end, a yellow circle is present at the end of the clone from which it was derived. BAC clones were isolated from the C57BL/6J library (black lines), from the 129/Sv library (blue lines), or from the Research Genetics CITB library (*). The size of each BAC as determined by PFGE analysis is indicated. C57BL/6J BAC clones selected to represent the minimal tiling path are indicated by black arrowheads. The map is displayed with equal spacing between STS/EST markers and the depicted clones together span a distance of ∼1300 kb. The orientation of the 5′- and 3′-Gabrg1 markers with respect to surrounding STSs on the contig could not be determined.