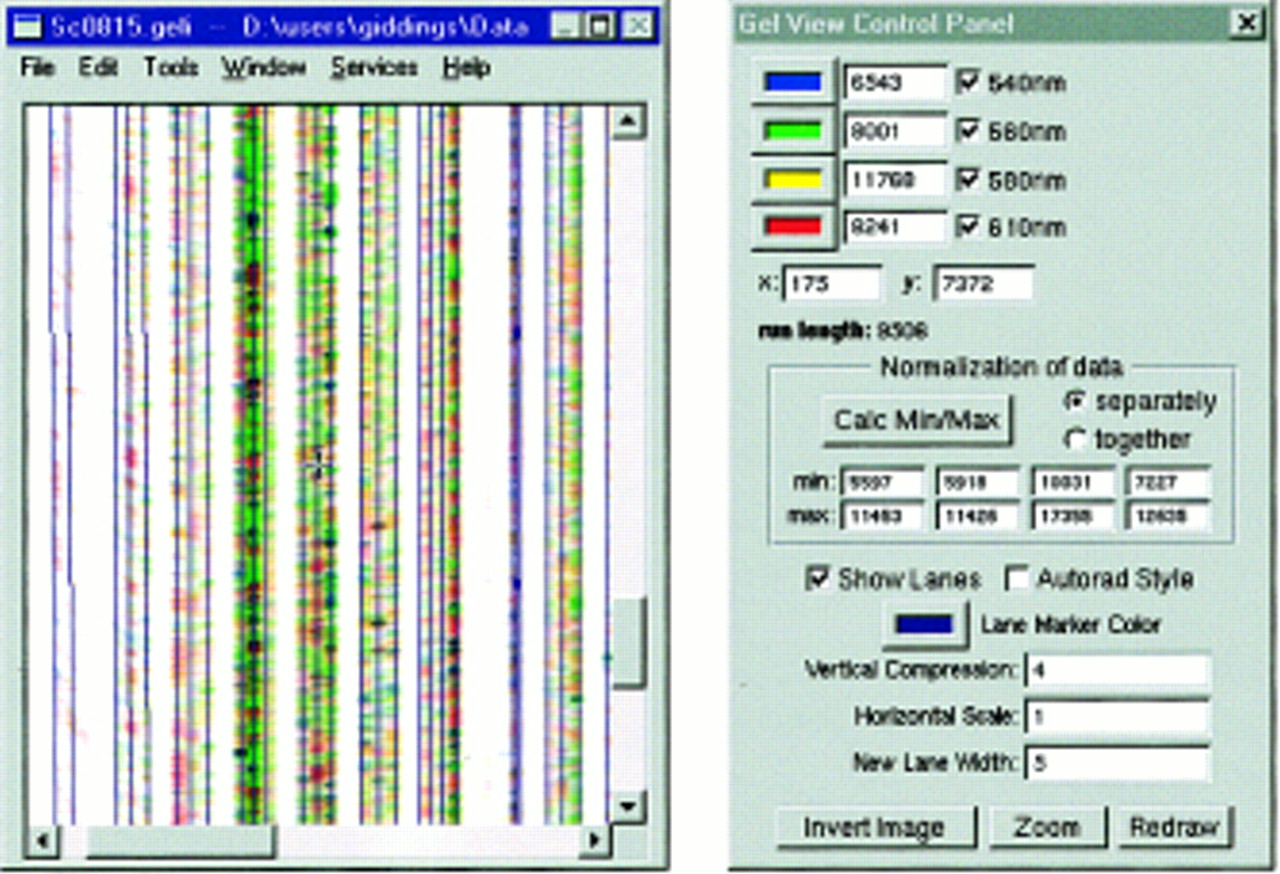
A screen capture of the GelImager program running in Windows NT. The left window is the main gel image view, displaying an image collected from the scanning electrophoresis system developed in our laboratory, with lane marks superimposed on lanes as determined by Getlanes, and then manually edited. The vertical dimension in the image corresponds with scan number (run-time), with earlier scans toward the top. The horizontal dimension corresponds with intensity values collected on a scan by the optical system across the gel plates. The lane fifth from the right of the window is shown selected, with two lane delimiter lines and several inflection points that can be adjusted to follow curves in the lane. The right window is the main control panel. It provides for adjustment of items such as color mapping (color wells near top), data display normalization (central position), and image size scaling in the gel view window (values near the bottom). It also shows the position of the cursor in the window (x: andy:), and the intensity values at the cursor position (the numerical values next to the color wells).