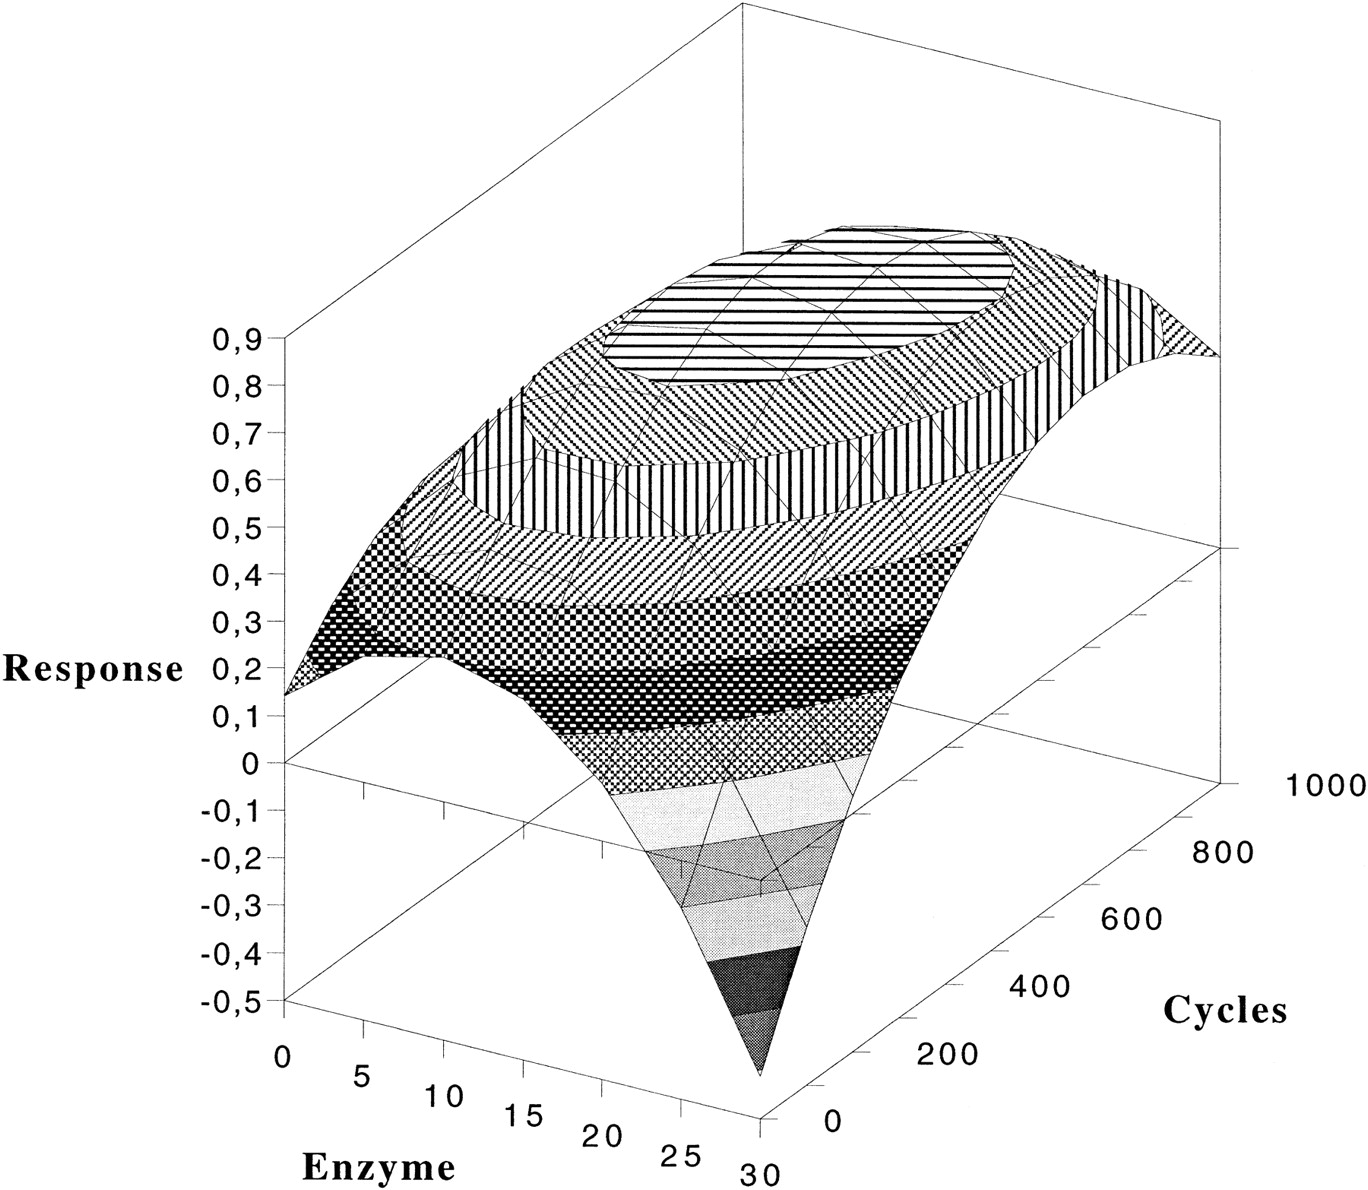
An example of a response surface plot illustrating the effects of variations in enzyme concentration and cycle number.