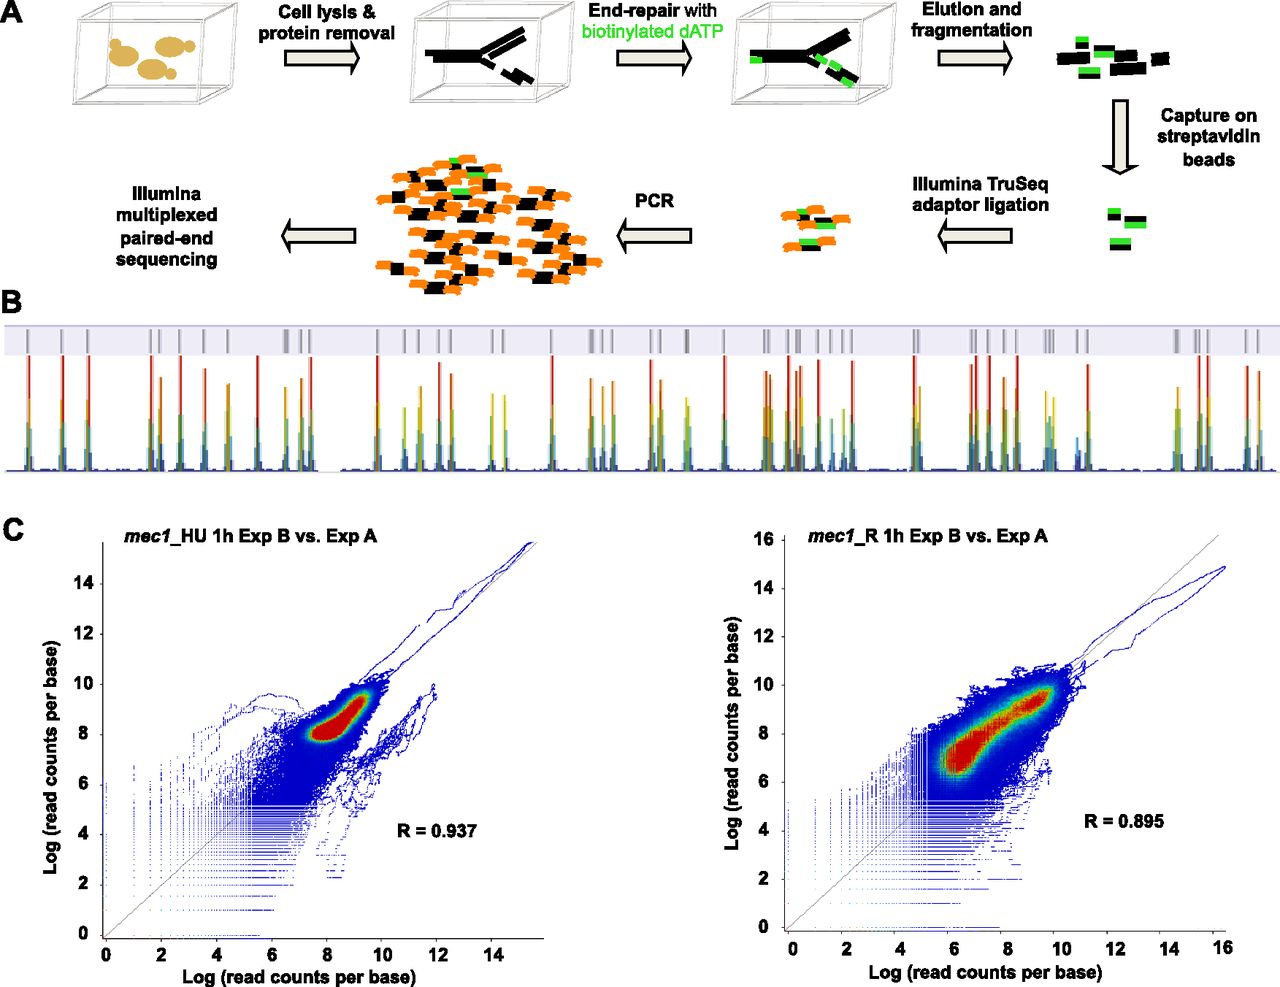
(A) Schematic representation of Break-seq procedures. Chromosomal DNA is shown embedded in agarose plugs (depicted by cubes) for in-gel labeling for DSBs. (B) View of a portion of Chromosome X (105,000–500,000 bp) showing the concordance between DSBs from the BamHImec1, G1 (control) sample and the known BamHI sites (the annotation track on top). The data track is shown at the bottom. Color scales from blue to red indicate increasing number of sequence reads in a given window. (C) Scatter plot of Pearson’s correlation between two biological replicate experiments. Log transformed values of read counts per base normalized to total number of sequenced bases are plotted for the HU samples (left) and the Recovery samples (right). In each plot, the values from the Exp A samples are plotted on the x-axis and those from the Exp B samples on the y-axis.