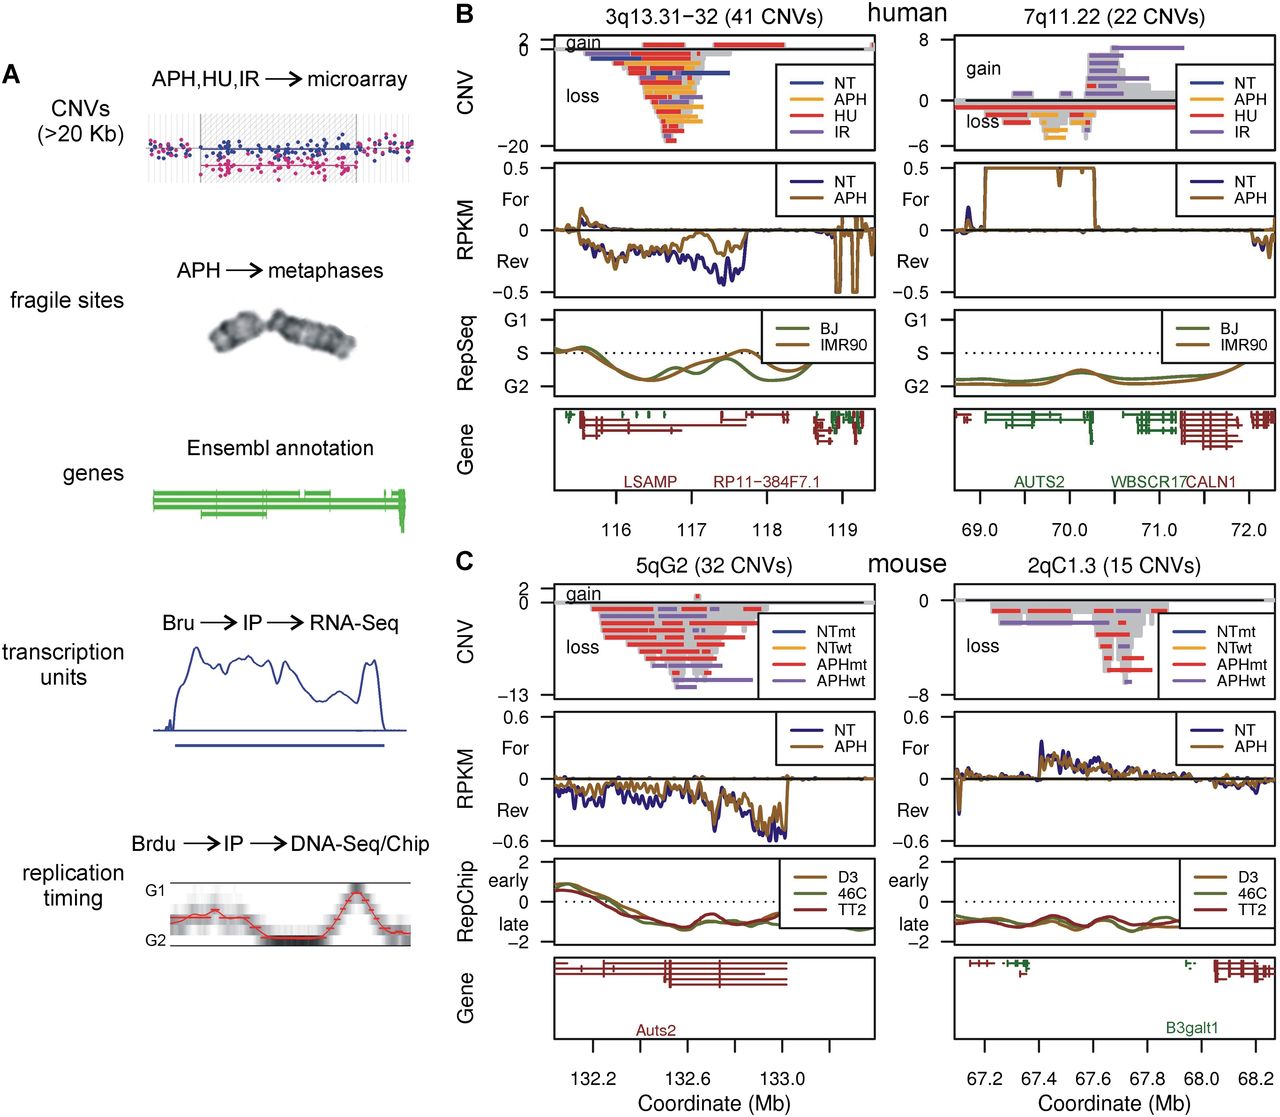
Human and mouse CNV hotspot examples. (A) Summary of the genome features compared in this study and their acquisition methods. (B,C) Profiles of the two most highly clustered de novo CNV regions in human 090 fibroblasts and mES cells, respectively. CNVs are drawn as horizontal bars. The number of CNVs overlapping each genome bin is plotted as a gray histogram: positive CNV counts, duplications/gains; negative counts, deletions/losses. Bru-seq transcription data are plotted as follows: positive RPKM, forward transcription; negative RPKM, reverse transcription. ENCODE Repli-seq data (RepSeq) are plotted as the calculated replication timing, Repli-chip (RepChip) as the log2 of the replication timing ratio. Genes are shown as Ensembl transcripts: green lines, forward gene orientations; red lines, reverse orientations. Except for mouse B3galt1, labels are suppressed under 500-kb gene lengths. (NT) Untreated; (APH) aphidicolin; (HU) hydroxyurea; (IR) ionizing radiation; (wt) Xrcc4+/+; (mt) Xrcc4−/−. See Supplemental Figure S1 for additional profile plots.