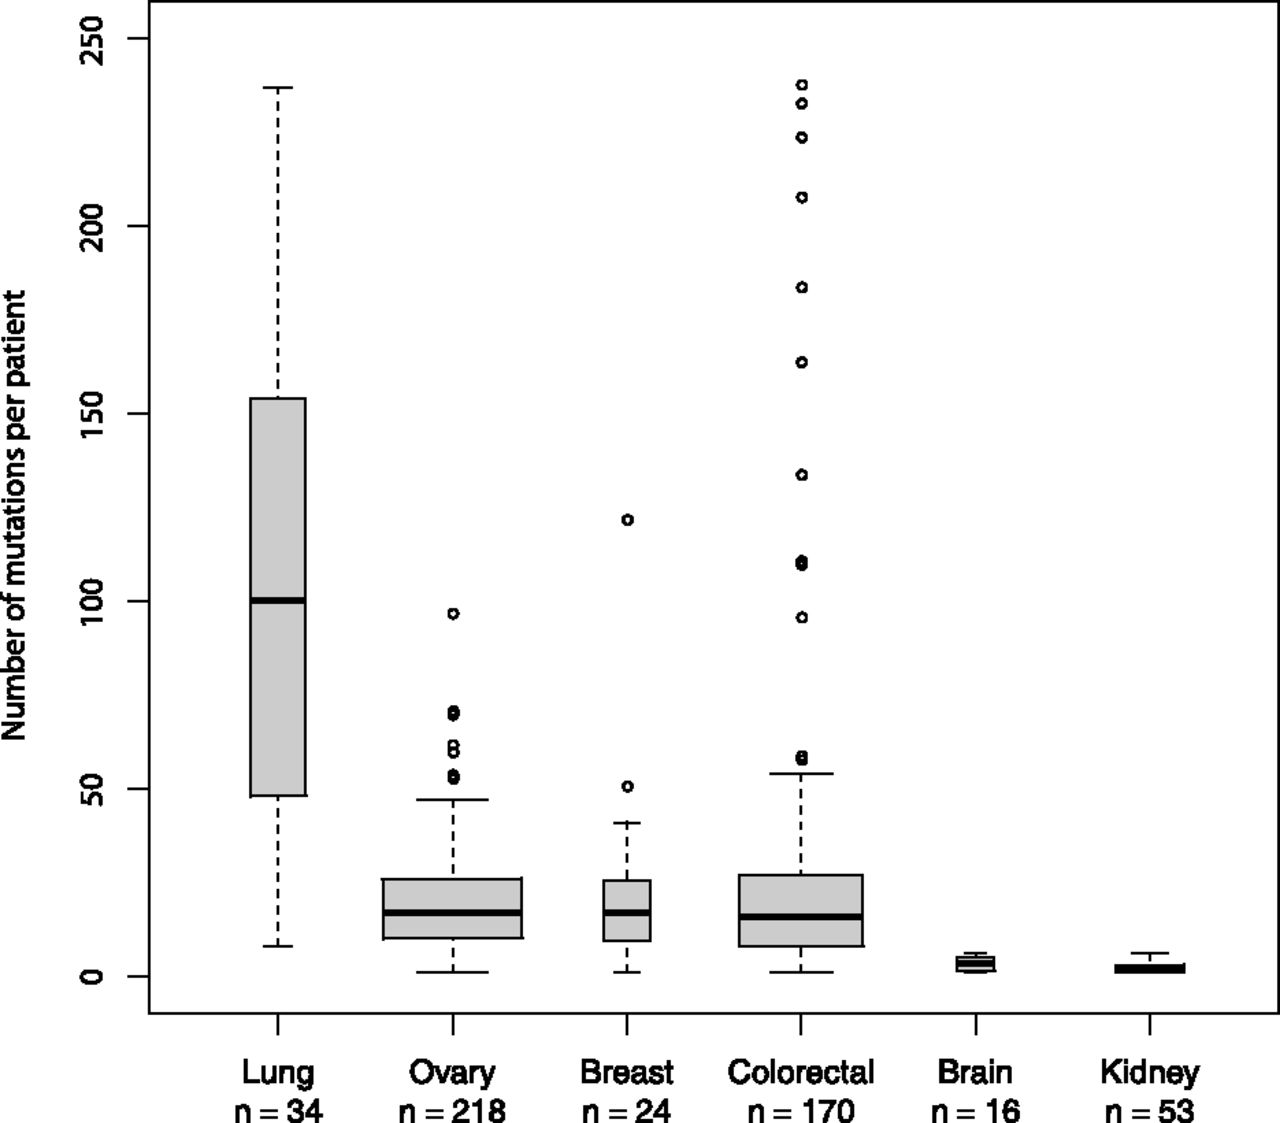
Figure 1.
Boxplots showing the number of mutations per patient for each cancer type. The y-axis is cut off at 250 mutations for better visualization of the majority of the data. The dark horizontal bar shows the median, whereas the box encompasses the interquartile range (middle 50% of the data). Whiskers reach the farthest data point that is within 1.5× the interquartile range from the nearest box edge (quartile). Box width is proportional to the sample size (lung: 34, ovary: 218, breast: 24, colorectal: 170, brain: 16, kidney: 53).