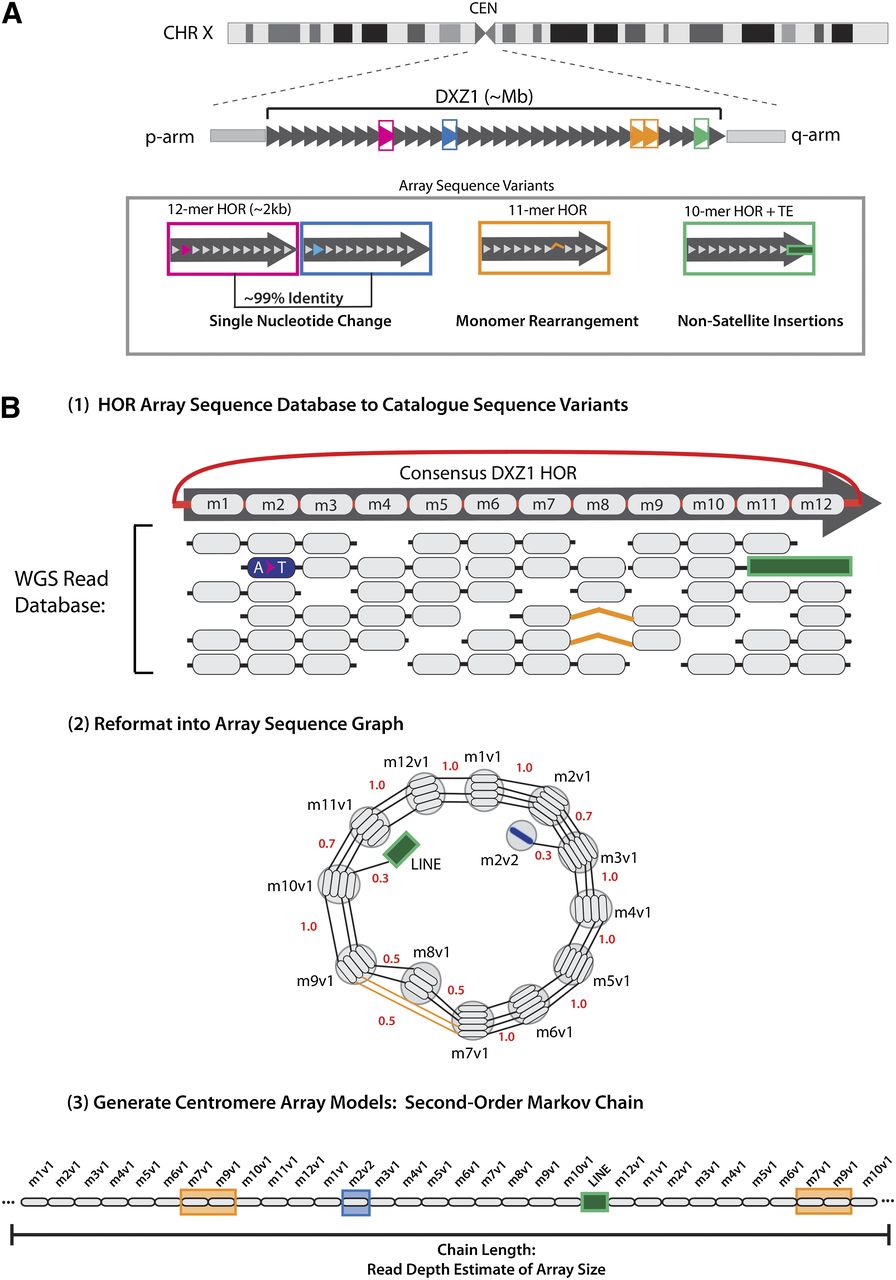
An algorithmic overview of satellite characterization and linear representation. (A) Cartoon depiction of centromeric array spanning the complete centromere assigned gap on chromosome X. The multimegabase-sized DXZ1 array is comprised of tandemly arranged higher-order repeats, shown as dark-gray arrows. Examples of array sequence variants are indicated as follows: between pink and blue boxes, single-nucleotide change, illustrated in the second monomer of the HOR; orange box provides a description of monomer rearrangement with a deletion in HOR monomer order; and green box demonstrates a site of transposable element insertion interrupting the repeat. (B) To generate linear representation of these sequences the algorithm uses three key steps: First, an array sequence database is generated, where full-length monomers that are identified on each WGS read are organized relative to the DXZ1 HOR canonical repeat, with sites of variation as indicated. Second, read databases are reformatted into sequence graphs, wherein nodes are defined by identical monomers and edge weights are defined by the normalized read counts that define each observed adjacency in the WGS read database. Finally, traversal of the graph using a second-order Markov model provides a linear description of the original read database: presenting variant sequences in proportion and preserving the local-monomer ordering (defined by length of read database ∼500 bp) as observed in the initial read database.