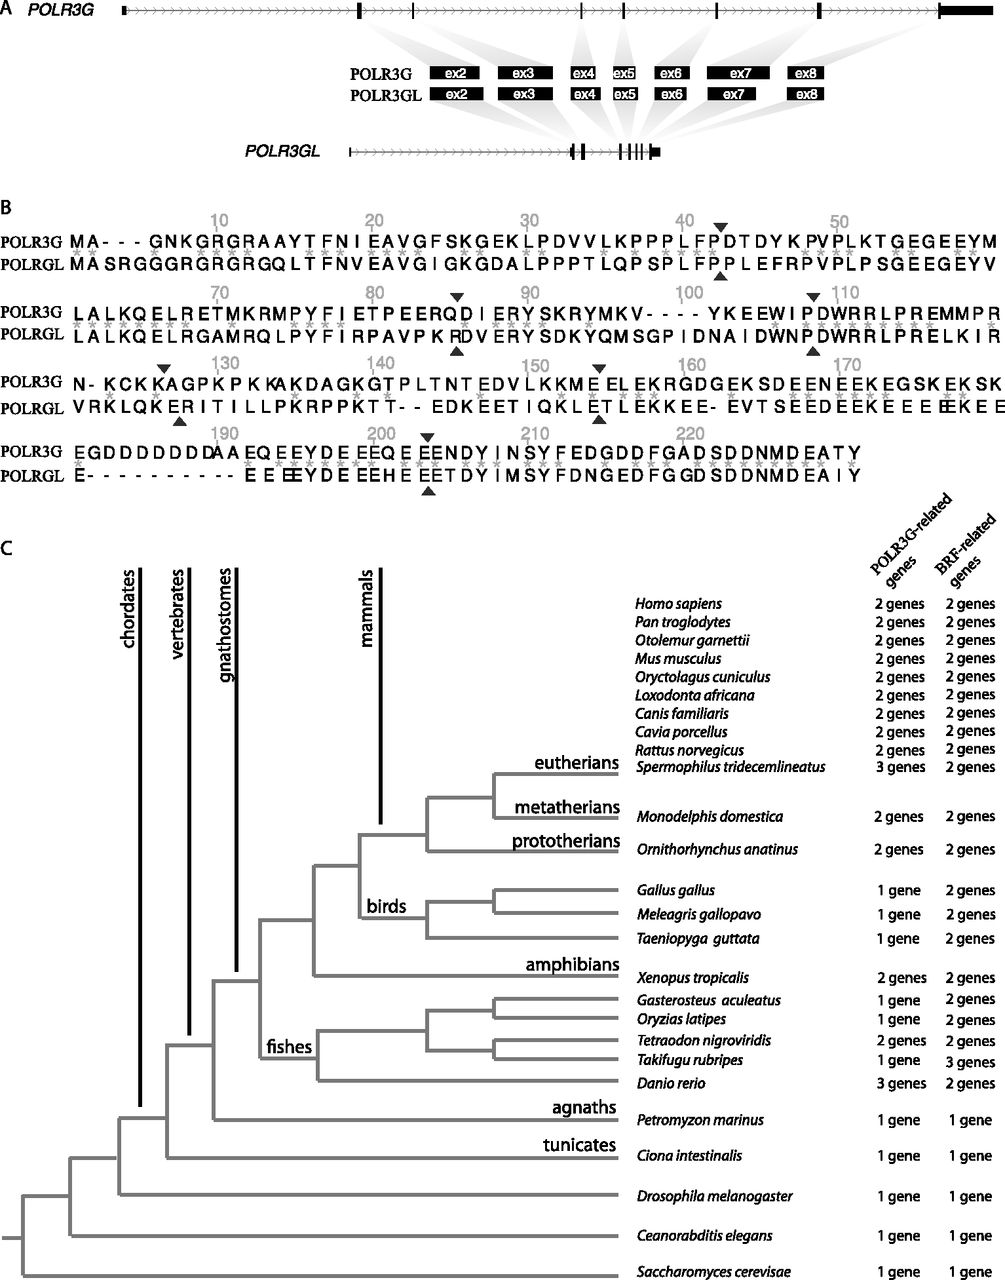
Figure 1.
Evolution of the POLR3G and POLR3GL genes. (A) The genomic organization of the POLR3G (top line) and POLR3GL (bottom line) genes is shown with coding parts of exons as thick boxes, noncoding parts of exons as thinner boxes, and introns as lines with the arrowheads indicating the sense of transcription. The corresponding POLR3G and POLR3GL protein sections are schematized in the middle of the panel. (B) Alignment of POLR3G and POLR3GL protein sequences showing the borders (arrowheads) of corresponding exons. (C) Number of POLR3G and BRF homologs in different species. Species were classified according to species phylogeny. The numbers of detected POLR3G and BRF-related genes are indicated on the right.