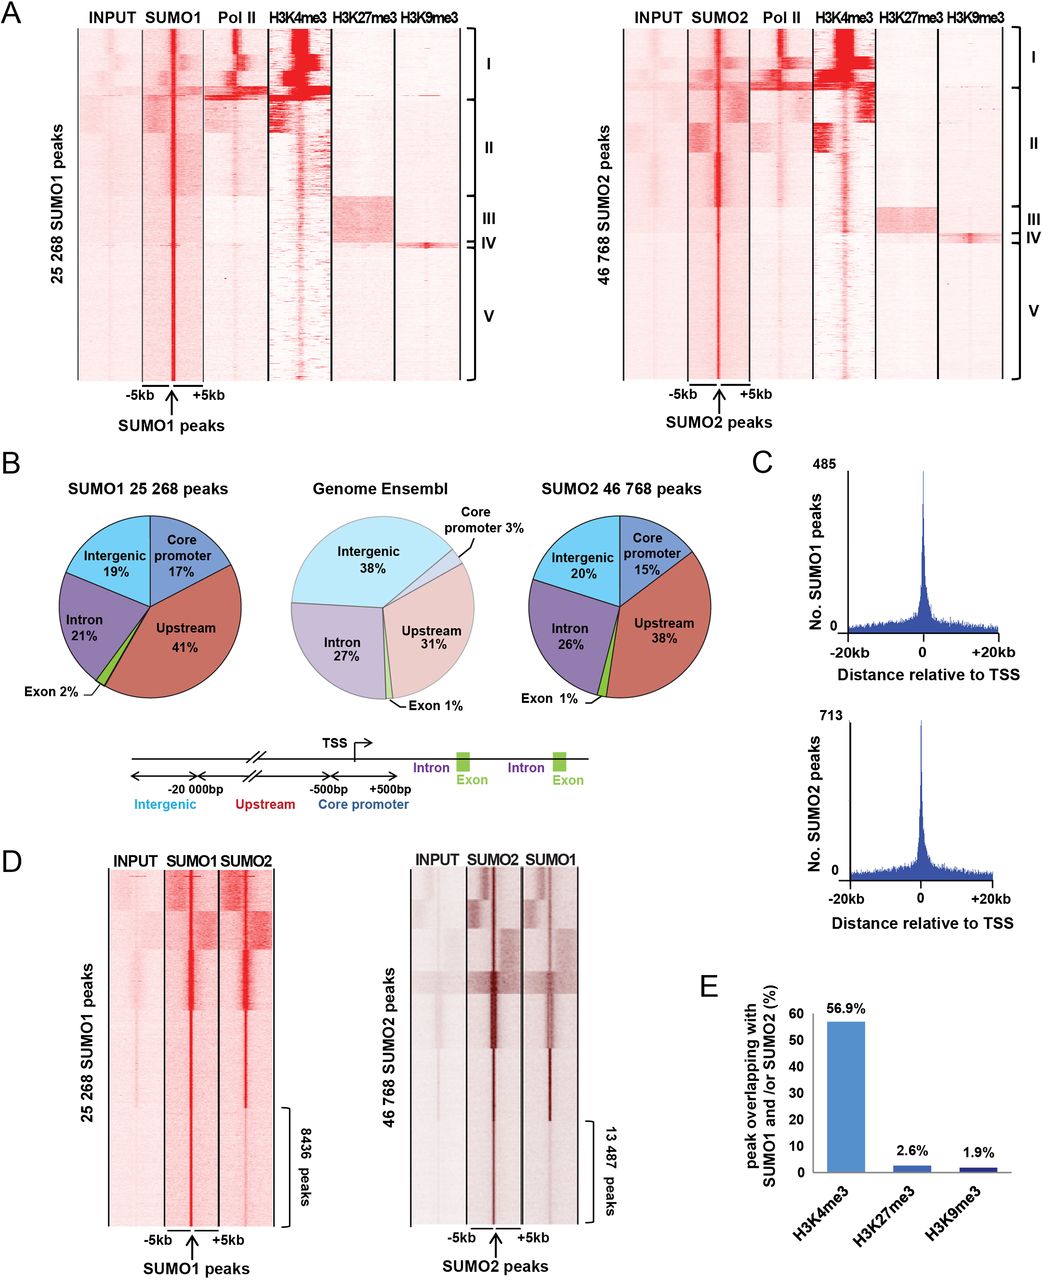
Chromatin profiles of SUMO1 and SUMO2. (A) Association of SUMO1 (left) and SUMO2 (right) with Pol II, H3K4me3, H3K27me3, and H3K9me3 in WI38 cells. Comparison of tag density in the region of ±5 kb around the SUMO-occupied loci. Clustering identifies five classes as indicated. (B) A pie chart representation of the distribution of SUMO sites in five different genomic regions. The definition of each region is described below. (C) Frequency of SUMO1 and SUMO2 site localization with respect to TSS. (D) Comparison of SUMO2 tag density around the SUMO1 peaks (left) and of SUMO1 tag density around the SUMO2 peaks (right). (E) Histogram representing the percentage of the H3K4me3, H3K27me3, or H3K9me3 peaks with an overlapping SUMO1 and/or SUMO2 peak.