Skip to main content
Figure 1.
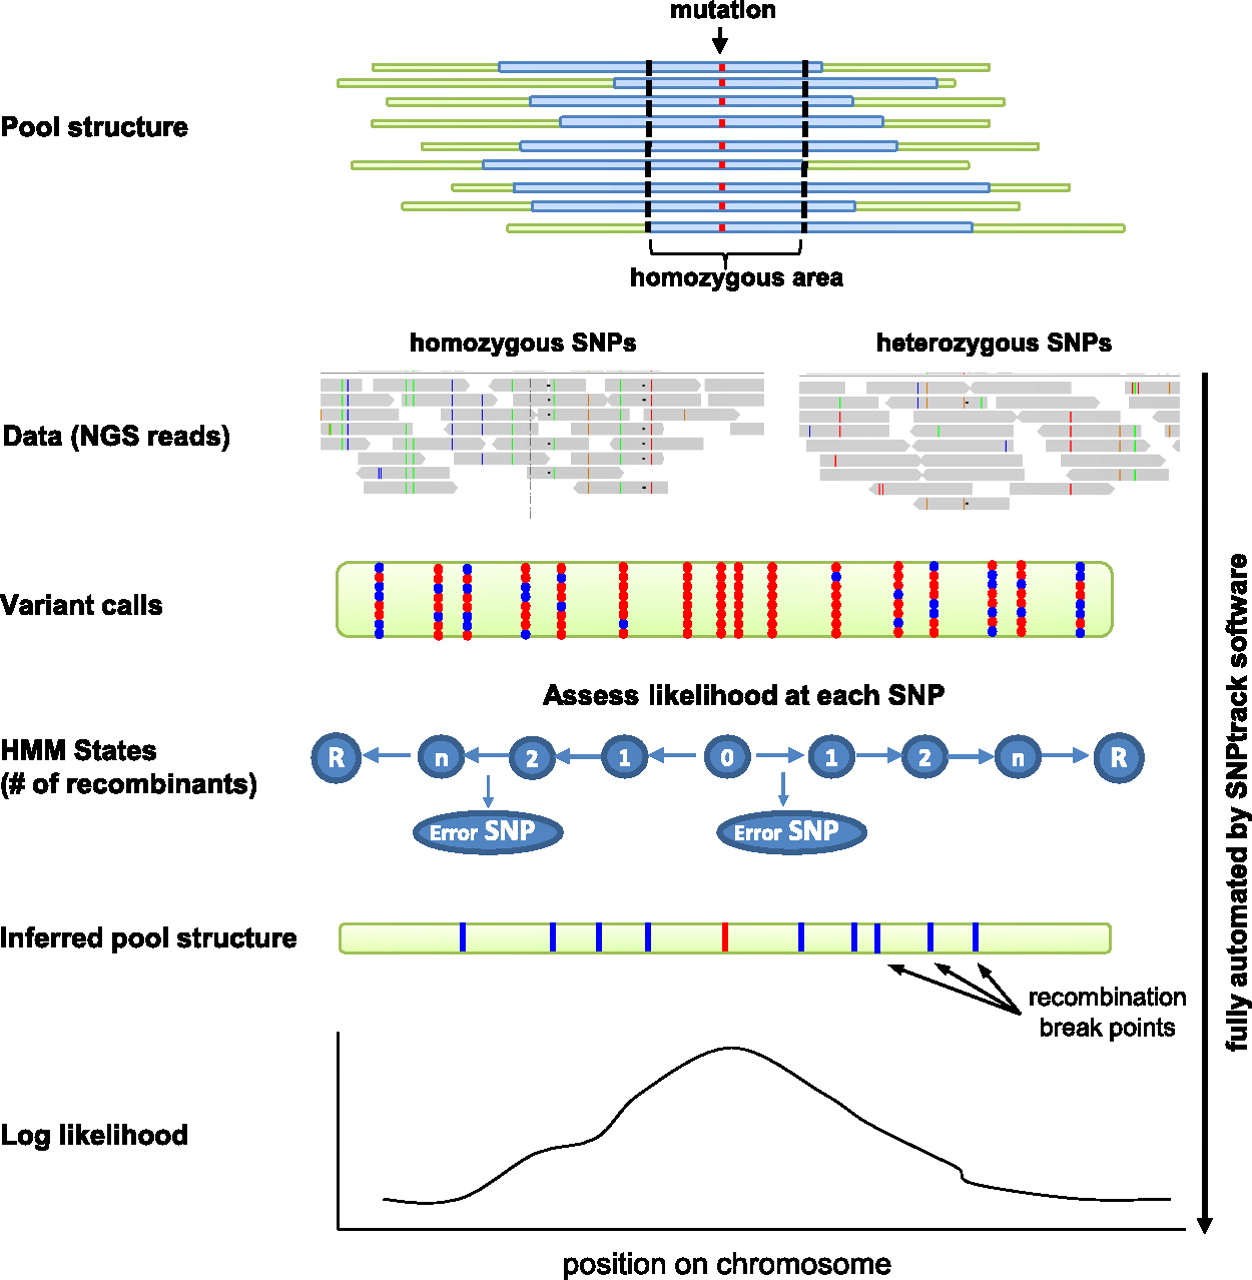
Schematic representation of mutation analysis by NGS and SNP mapping.