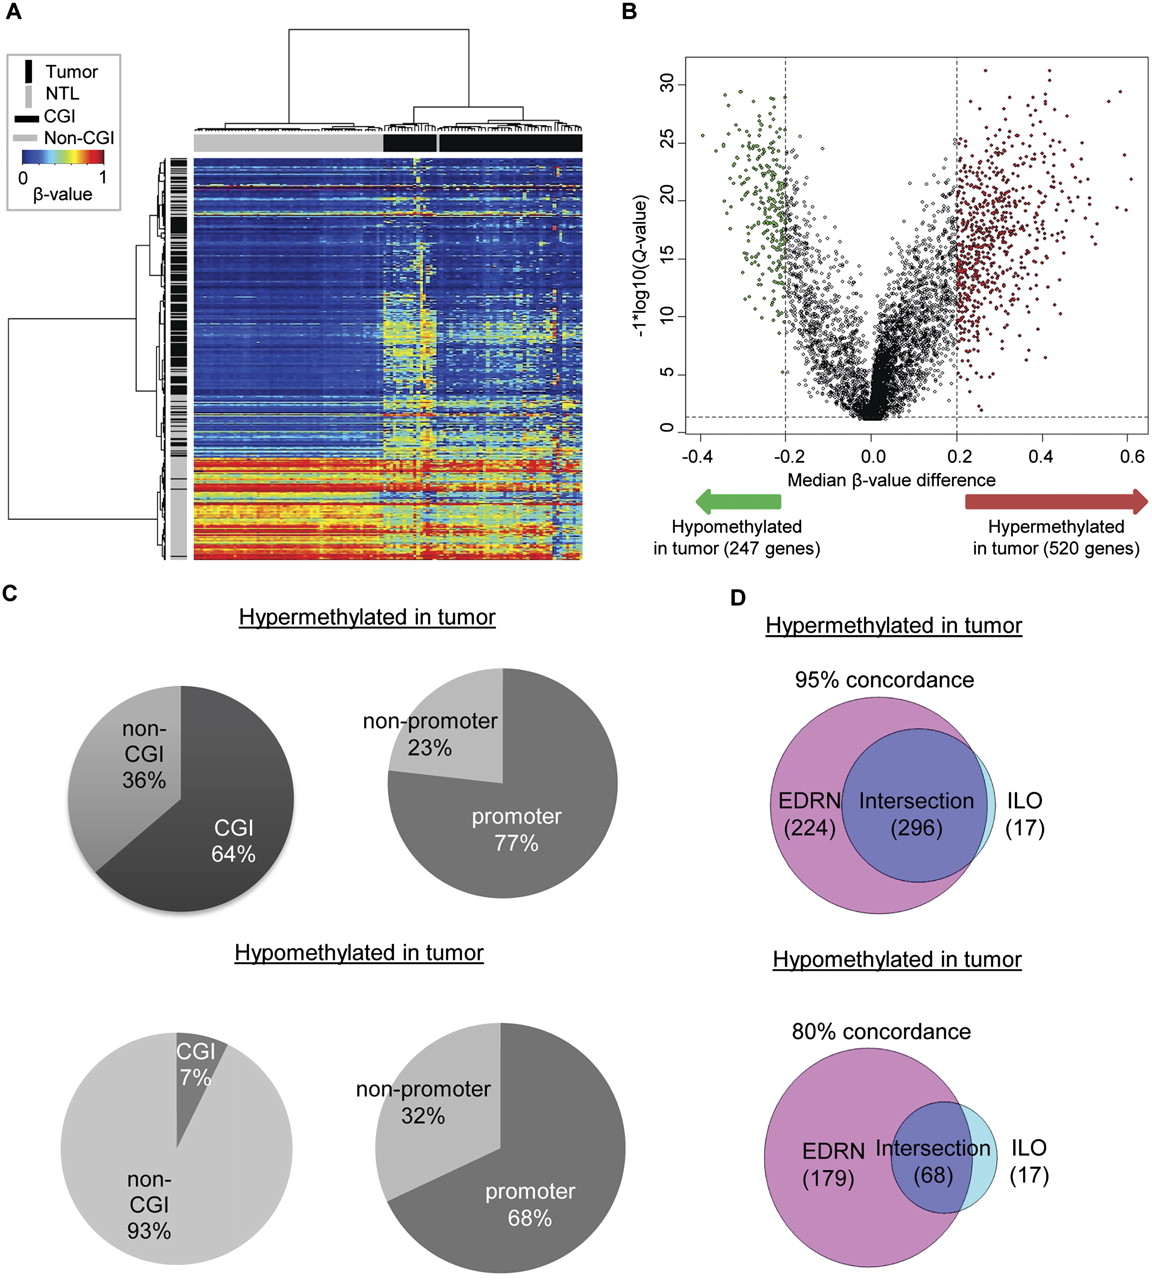
Identification of DNA methylation differences between lung adenocarcinoma and NTL. (A) Two-dimensional hierarchical clustering was performed using the 5000 most variable Infinium DNA methylation probes across all samples (n = 117). Probes are in rows; samples are in columns. Note that both hypermethylation and hypomethylation in tumors compared with NTL is seen, and that hypomethylation largely occurs outside of CpG islands. (B) Volcano plot of the differential DNA methylation analysis. (X-axis) Median β-value difference (median tumor-median NTL); (y-axis) Q-values for each probe (−1 × log10 scale). (Vertical dotted lines) 20% change in β-values; (horizontal dotted line) the significance cutoff. One gene, CDH13, showed both significant hypermethylation and hypomethylation (see text and Supplemental Figs. 3 and 4). (C) Proportions of probes from genes with associated CpG islands (CGI) and probe locations, categorized as promoter (±1 kb from TSS) or nonpromoter regions. (D) Overlap of significant unique gene lists using an independent sample set (see also Supplemental Figs. 2 and 5).