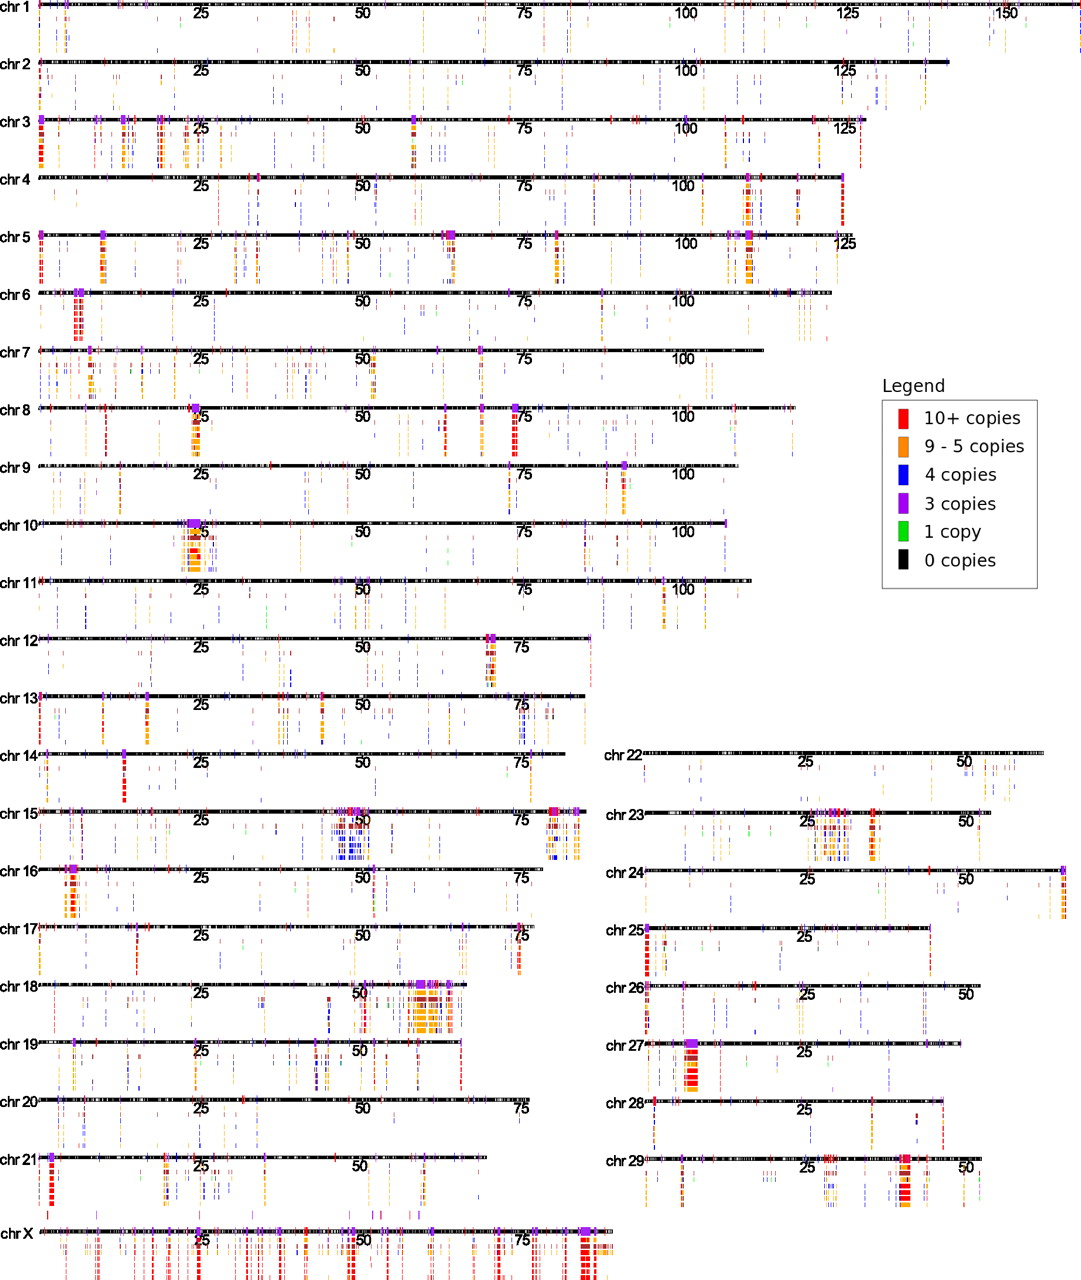
Figure 1.
Individualized cattle CNV map. The Btau_4.0 assembly is represented as black bars with assembly gaps indicated by white boxes on the chromosomes. Larger bars intersecting the chromosomes represent the previously discovered WSSD (red), WGAC (blue), and WSSD/WGAC joint-prediction (purple) regions. Tracks underneath the chromosomes represent the CNV data sets (in order from top to bottom) for DTTRACE, merged CNVRs from all data sets, BINE, BTAN1, BTAN2, BTAN3, and BTHO. The colors for each bar in the animal data set tracks represent the average estimated CN for each CNV as shown in the legend. The merged CNVR track does not have CN information and is uniformly colored brown.