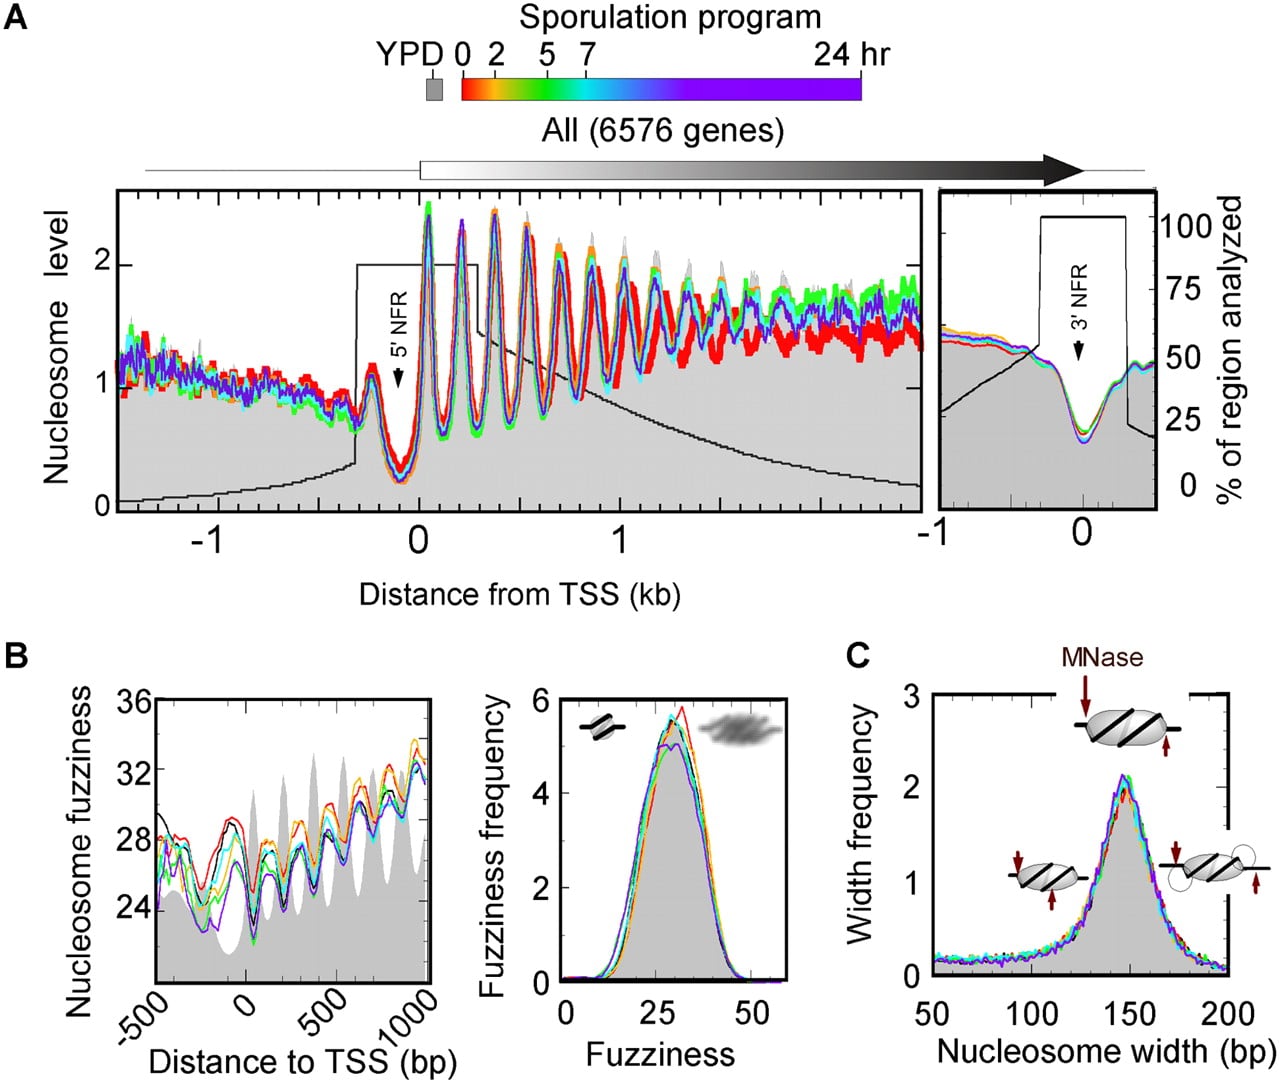
Nucleosome organization around genes throughout sporulation. (A) Composite nucleosome distribution traces for six time points in the meiosis/sporulation program are color-coded as indicated. Nucleosome midpoint density is represented by sequencing tag counts from cross-linked, MNase-digested, H3 immunoprecipitated, and gel-purified samples. Distributions were normalized such that the total tag count in each sample was equal. Tag counts are distributed about 6576 transcript start (TSS) and end (TES) sites in 3-bp bins and 15-bp bins, respectively, and smoothed via a three-bin moving average. The percentage of regions analyzed is indicated by the black trace and covers a minimum of ±300 bp from the TSS or TES and a maximum of 300 bp from the next TSS or TES. Bin counts were normalized to the number of regions represented in each bin. (B) Nucleosome fuzziness was taken to be the standard deviation of tag locations for each nucleosome. The average fuzziness per bin was determined, then plotted as described in A. (Right) A frequency distribution of nucleosome fuzziness at various meiotic time points. Color codes are as in A, except that YPD is represented by a black trace. (C) Frequency distribution of nucleosomal widths (distance between the W/+ and C/− MNase-digested borders).