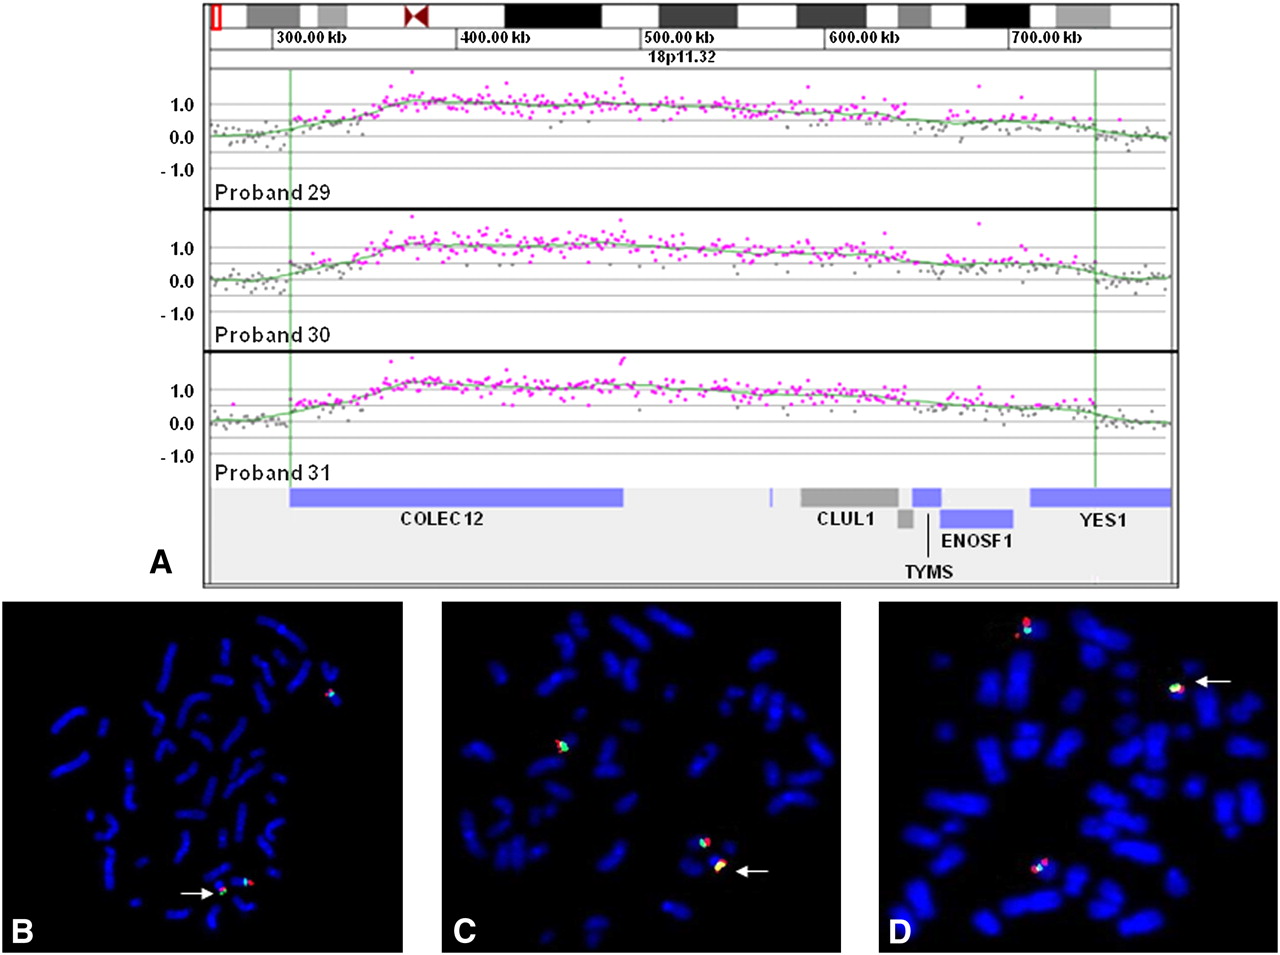
Characterization of recurrent der(Y)ins(Y;18)(?p11.2;p11.32p11.32) by oligonucleotide array CGH and FISH. (A) Oligonucleotide microarray results showing identical single-copy gains of 340 probes from 18p11.32, ∼437 kb in size (chr18:309,785–747,102 based on UCSC 2006 hg 18 assembly), in three probands. Probes are ordered on the x-axis according to physical mapping positions, with the most distal 18p11.32 probes to the left and the most proximal 18p11.32 probes to the right. Values along the y-axis represent log2 ratios of patient:control signal intensities. Genes in the interval are shown as blue and gray bars below. (B) Metaphase FISH results showing insertion of RP11-720L2 (red) from the duplicated region on chromosome 18 in proband 29 into the pericentromeric region of the Y chromosome (arrow). (Green) A centromere probe for chromosome 18 and a Yp11.31 probe specific to SRY (RP11-400O10). (C) Metaphase FISH results showing insertion of RP11-133D9 (red) from the duplicated region on chromosome 18 into the pericentromeric region of the Y chromosome in proband 30 (arrow). (Green) Centromere probes for chromosome 18 and the Y chromosome. (D) Metaphase FISH results showing the insertion of RP11-720L2 (red) into the pericentromeric region of the Y chromosome in proband 31 (arrow). (Green) Centromere probes for chromosome 18 and the Y chromosome.