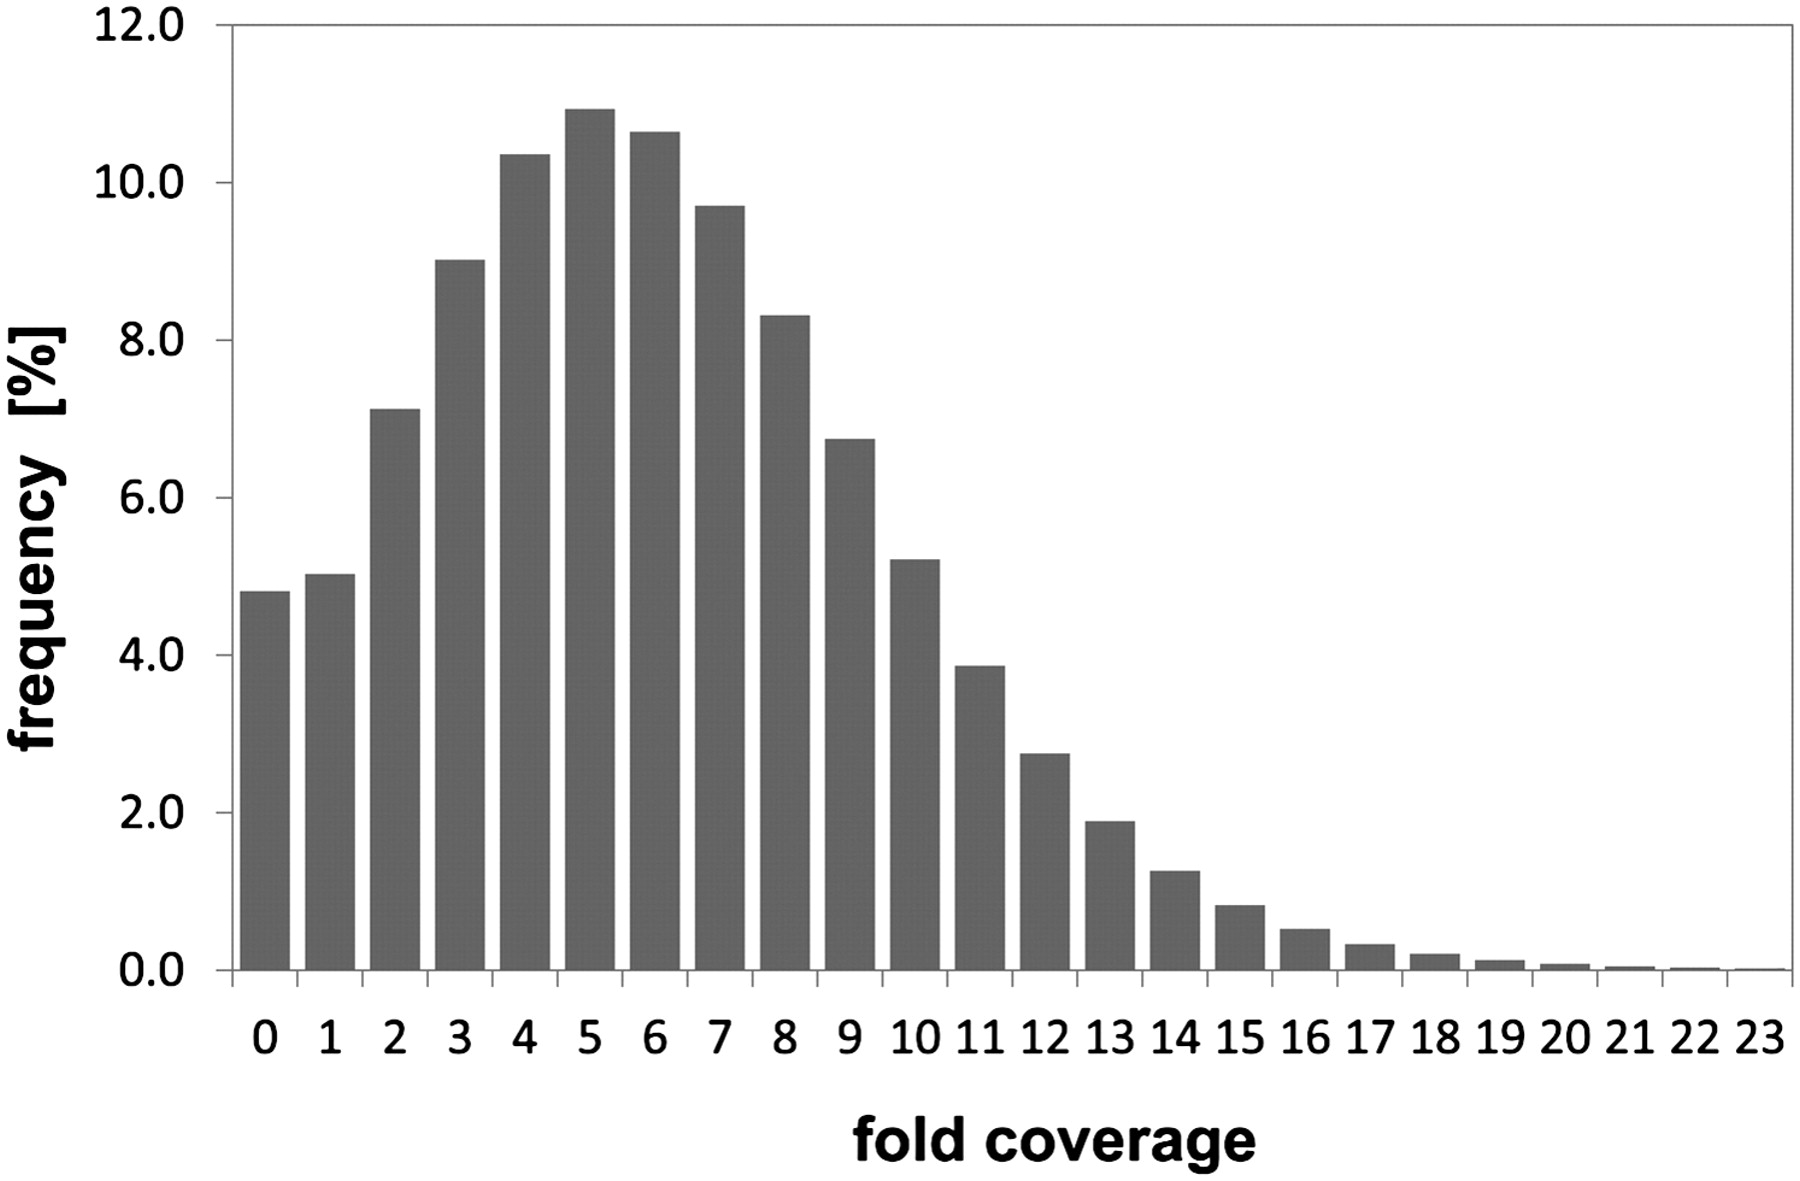
Figure 1.
Coverage histogram of the M. fascicularis genome draft. The histogram shows the coverage distribution from the combined 454 and SOLiD reads of the M. fascicularis genome mapped to the reference genome (RheMac2). The frequency of nucleotide positions was plotted against the sequence coverage. Coverage exhibited a Poisson-like distribution with a mean of sixfold sequence coverage. The lowest bin in the histogram represents reference positions with zero aligned reads. About 80% of these noncovered positions are annotated as being repetitive in the RheMac2 draft.