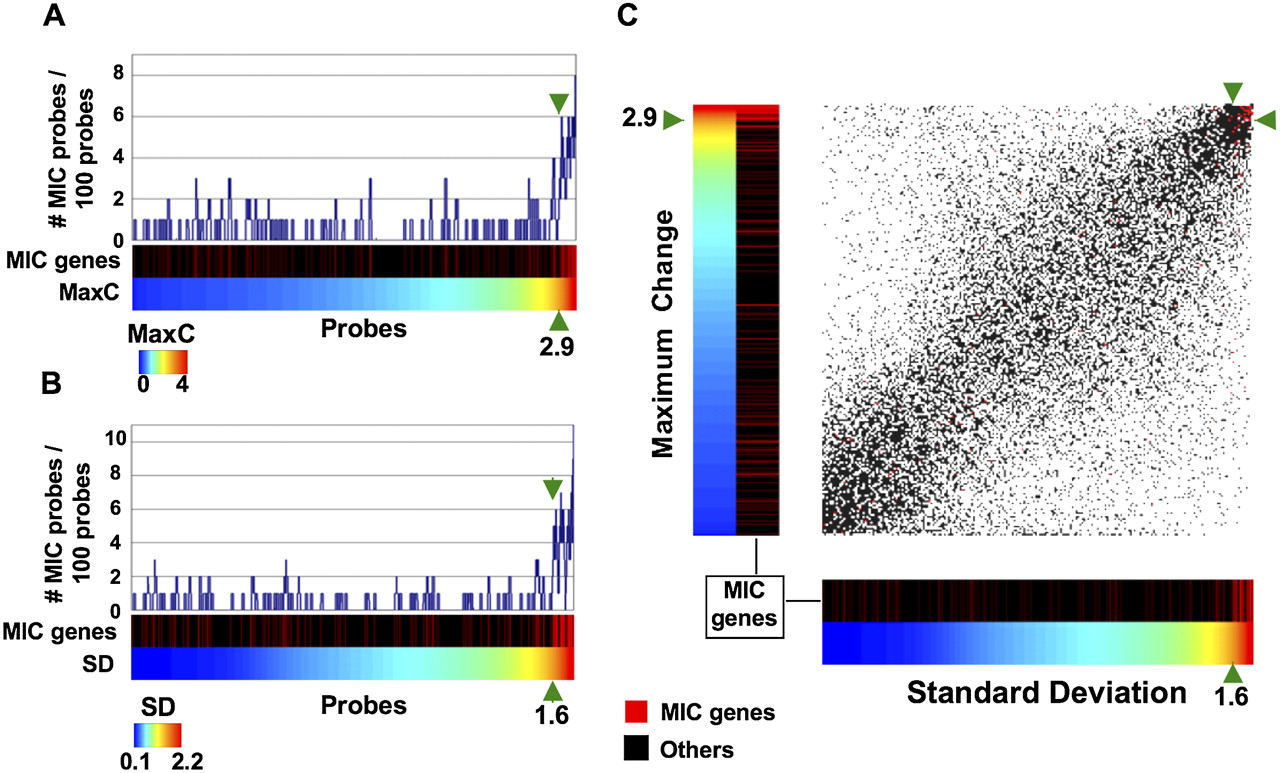
Defining threshold criteria for prediction of methylation. Analysis of expression of the MIC genes from ovarian cancer cell lines for maximum change (MaxC) in expression following 5-Aza-dC treatment relative to mock-treated cells (A), for the standard deviation (SD) in expression among the mock-treated cells (B), and for the combination of these two parameters (C). In panels A and B, gene probes are arranged in increasing order of MaxC (A) or SD (B), indicated by the color bar at the bottom of each panel. The number of MIC genes represented in a 100-probe sliding window is indicated by the blue bar graphs. The positioning of MIC genes with respect to MaxC or SD is shown in the color bar below, with red lines representing MIC genes and other genes represented by black lines. Defined thresholds are indicated by the green arrows. In the scatter plot in panel C, each gene probe is represented by a single dot where x = SD and y = MaxC. (Red dots) MIC genes; (black dots) all other genes.