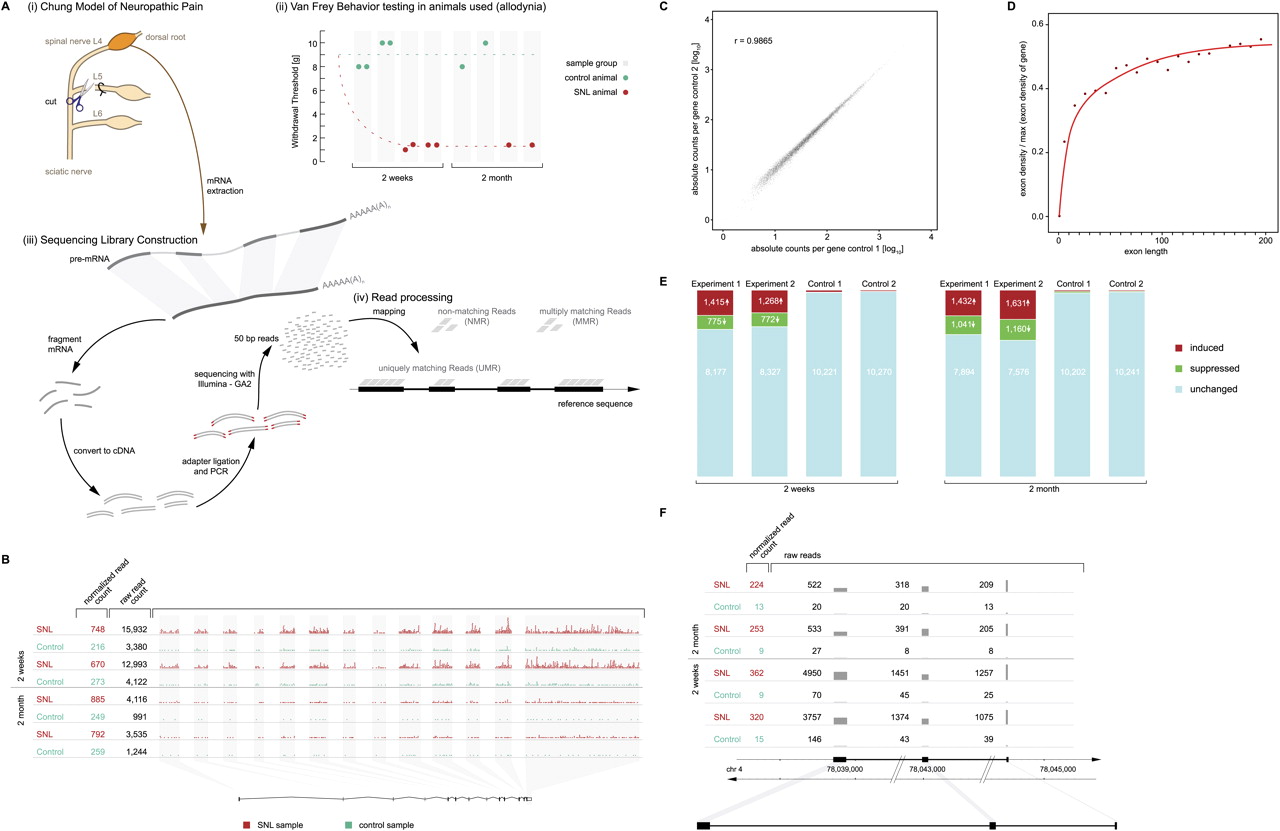
Expression of known genes altered in pain. (A) Experimental paradigm. (i) Neuropathic pain was modeled in rats by L5 SNL (“Chung model”), in which the L4 spinal nerve remains anatomically intact but the L4 DRG becomes dysfunctional, rendering the affected animal allodynic, i.e., the animal responds to light touch as if it were a noxious stimulus. (ii) Mechanical allodynia was confirmed prior to euthanasia by von Frey testing of the paw withdrawal threshold, which was abnormal (1.4–2 g) after SNL and normal (8–10 g) in sham-operated controls. (iii) Sequencing libraries were constructed from pools of two L4 DRG from different animals for the 2-wk time point (hence two behavior measurements per sample) and from a single DRG for the later time point (2 mo). RNA was isolated from the L4 DRG, poly(A)-purified, chemically fragmented, converted to a cDNA library, and sequenced. (iv) Resulting sequencing reads (50 bp long) were mapped to the entire rat genome and categorized as uniquely matching reads (UMR), multi-matching reads (MMR), and nonmatching reads (NMR) as detailed in Methods. (B) Gene-level analysis. Expression of each annotated gene was quantified by the total number of UMR mapping to its exons. The gene Gas7 (ENSRNOG00000003492), shown as an example, has 13 annotated exons. Each dot in the graph symbolizes 10 UMR observed. Sequencing depth at 2 wk was several-fold greater than at 2 mo, i.e., more reads were observed for each sample and gene, requiring correction in the comparative analysis. Normalized UMR counts (i.e., number of reads of the given gene per 106 reads obtained) are given in the left column, showing that the gene was induced 3.1-fold after SNL. (Each line marked as “SNL” or “Control” is an independent biological replicate.) (C) Reproducibility between biological replicates across 10,367 known protein-coding genes. Quantification of expression was highly reproducible across a wide range of gene expression levels because of the digital nature of the data. A tight correlation of read counts more than four orders of magnitude is shown. Correlation among biological replicates was high as indicated by a Pearson correlation coefficient of r = 0.99. (Correlation coefficients between all possible pairs in the study are shown in Supplemental Table 2). (D) Exon length versus average read coverage. A minimal exon length of 50 bp is required for a read to “fit” fully into an exon. Efficient quantification of expression by UMR is achieved for exons of ∼100 bp length or greater. Depicted is the relationship between exon length and average read density (normalized to expression levels of individual genes) for the entire data set (all annotated exons). (E) Expression changes in known genes. Approximately 20% of genes were found to be dysregulated in the L4 DRG (after L5 SNL). Results are shown here for 10,367 known protein-coding genes. The absolute number of genes found to be induced or suppressed by more than 1.7-fold is shown. The analysis was designed with a predicted FDR of 0.5% (i.e., 52 genes predicted to be “induced” and “suppressed”). The empirically determined FDR supported the assumption (“Control”) demonstrating that more than 2000 genes were significantly altered in expression (as discussed in detail in Results and Methods). The bar graphs shown are independent biological replicates for both time points studied (2 wk and 2 mo). (F) External validation by published reports. A gene previously known to be strongly induced in the DRG in rat pain models (Bonilla et al. 2002; Costigan et al. 2002; Sun et al. 2002; Valder et al. 2003; Davis-Taber and Scott 2006), Neuropeptide Y, was found by mRNA-seq to be among the most strongly induced genes at both time points studied. A comprehensive list comparing mRNA-seq results with published reports is provided in Supplemental Table 5.