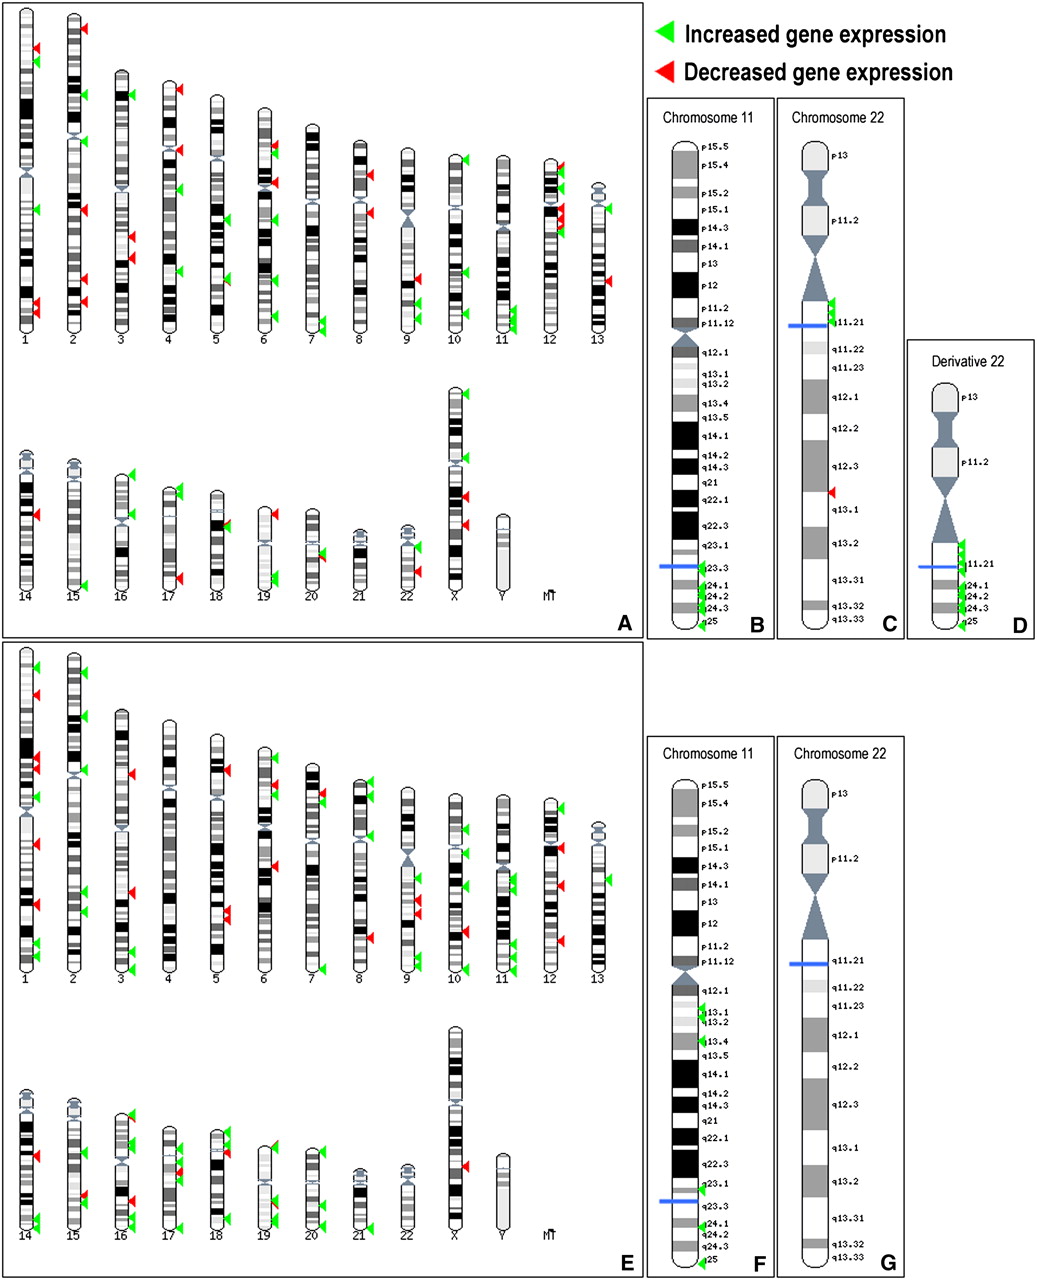
Mapping of t(11;22) and Emanuel syndrome differentially expressed genes. Ensembl Karyoview ideograms showing the chromosomal location of the top 100 differentially expressed genes between Emanuel patients (unbalanced) and controls (A–D) and between carriers of the balanced t(11;22) translocation and controls (E–G). Complete karyograms are shown in A and E, while detailed views of chromosomes 11 and 22 are shown in B and F, and C and G, respectively. The derivative chromosome 22, which corresponds to the trisomic regions in Emanuel syndrome patients, is shown in D. The blue lines indicate the translocation breakpoints. Green arrowheads mark the genes showing an increase in expression in cell lines from Emanuel syndrome patients (A–D) and translocation carriers (E–G), while red arrowheads depict those showing a decrease.