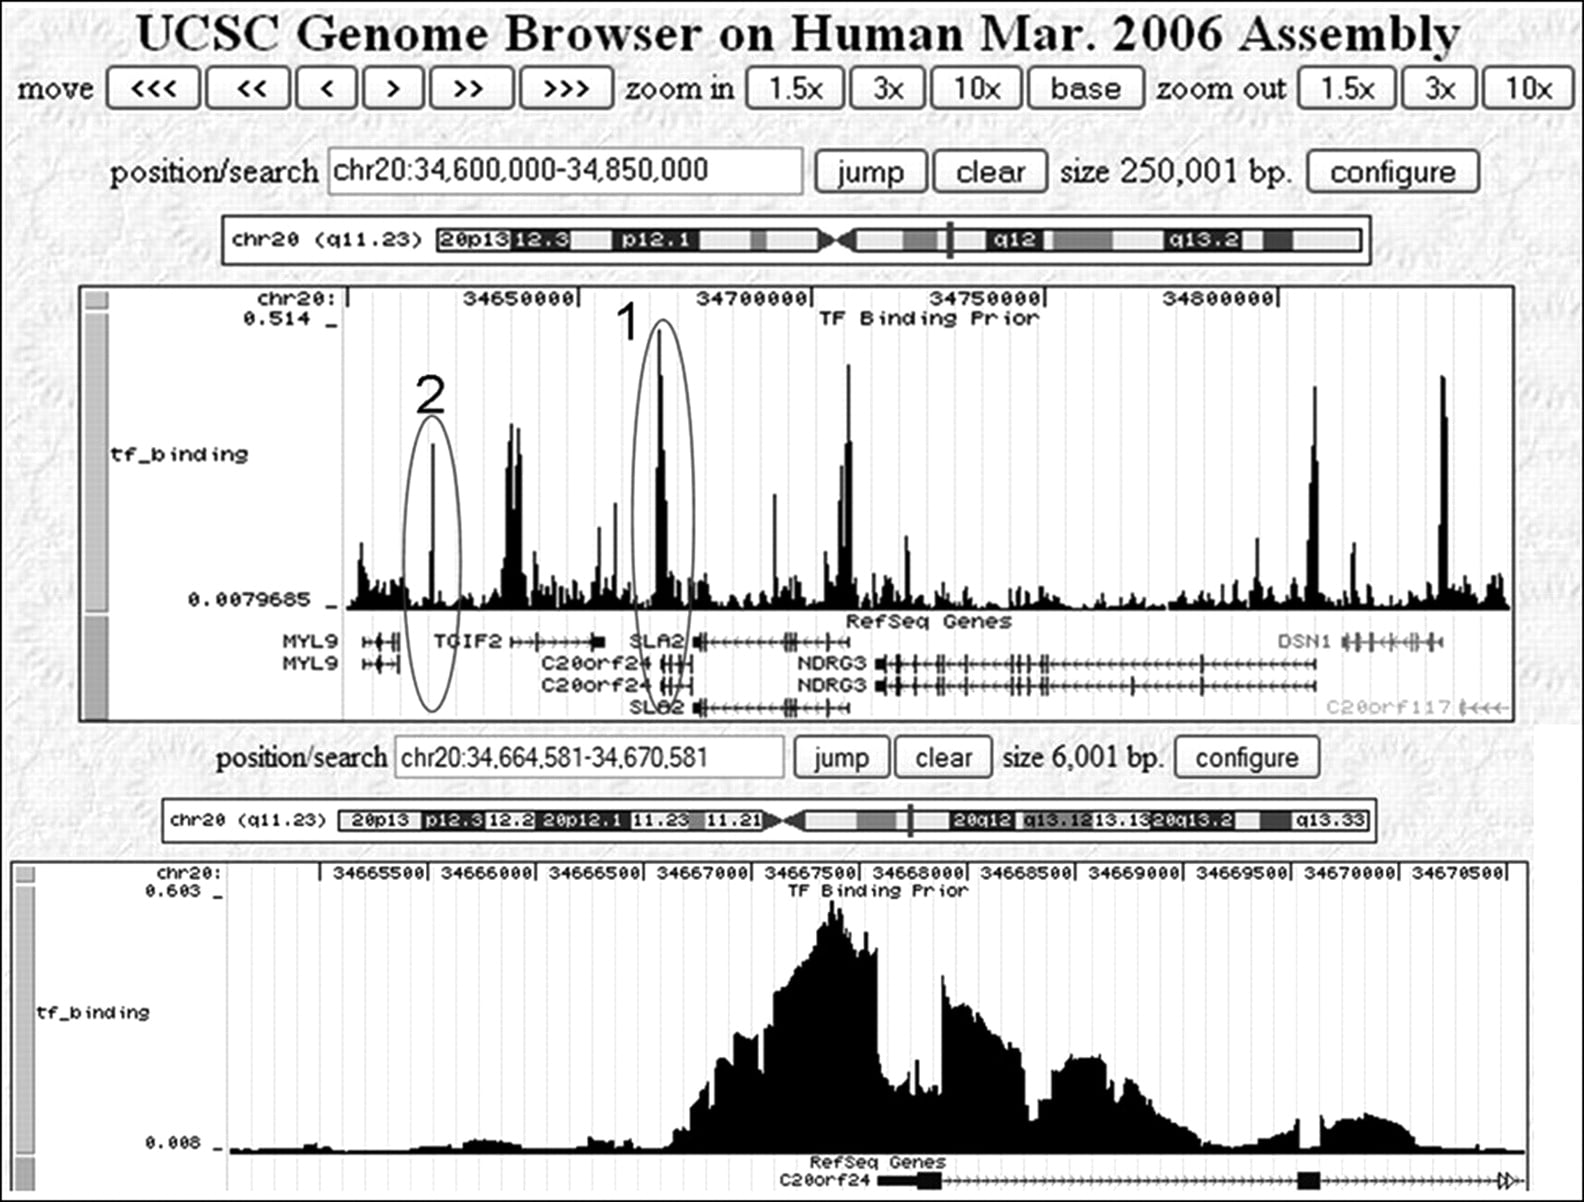
Figure 1.
Illustrative examples of the GBP of transcription factor binding. The GBP viewed using a custom track of the UCSC Genome Browser (Kent et al. 2002). (Top) A 250,000-bp region of chromosome 20 shows the GBP for transcription factor binding. Gene locations are displayed below the plot of the GBP. Most of the peaks in this image correspond to a RefSeq transcription start site. The peak in the oval labeled with a 2 does not, but is a DNase I hypersensitive region (Boyle et al. 2008). (Bottom) A zoomed in view of the peak in the oval labeled with a 1 from the top panel that is near the transcription start site of C20orf24. The exons of C20orf24 have lower probability than its immediate surrounding bases.