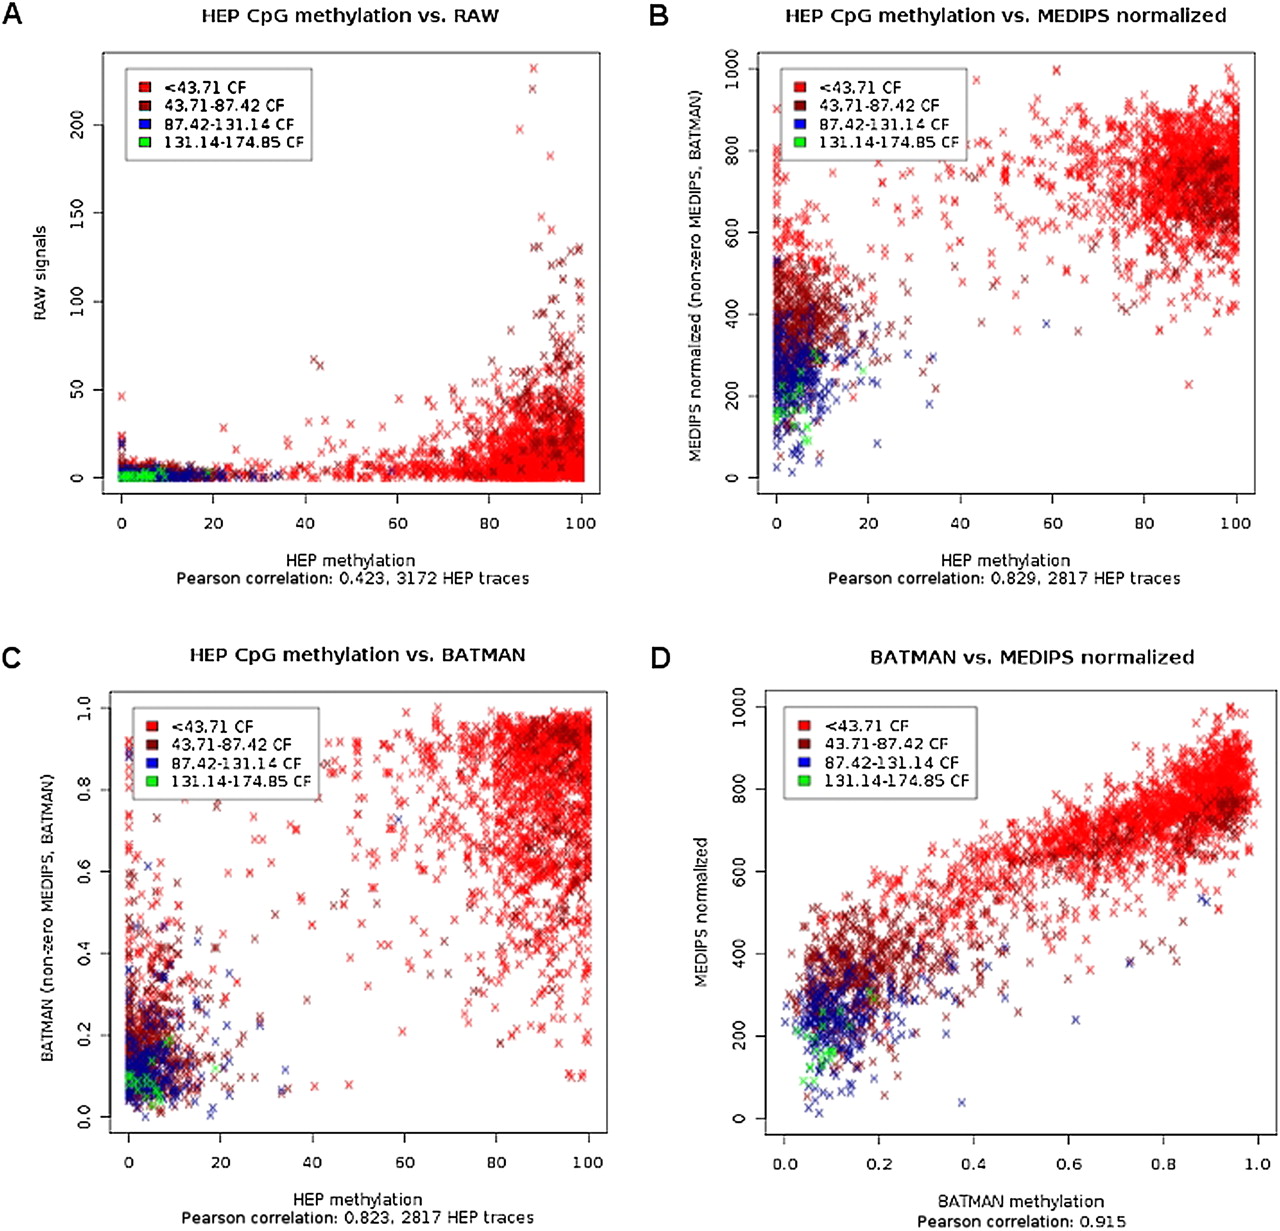
Normalization of MeDIP-seq data. We compared the normalization results of the MEDIPS method by processing publicly available MeDIP-seq data (Down et al. 2008) against bisulfite sequencing–derived methylation data from sperm samples (human epigenome project [HEP]) (Eckhardt et al. 2006). Each data point represents a genomic region analyzed by bisulfite sequencing (Eckhardt et al. 2006). The color code refers to four quantiles of the mean coupling factors (CpG densities) for these regions. Correlation plots show (A) raw MeDIP-seq signals (y-axis), (B) MEDIPS normalized signals (y-axis), and (C) Batman (Down et al. 2008) normalized (y-axis) signals against bisulfite data (x-axis) from the HEP project (Eckhardt et al. 2006). (D) Comparison of MEDIPS normalized against Batman (Down et al. 2008)-normalized MeDIP-seq data for the same genomic regions.