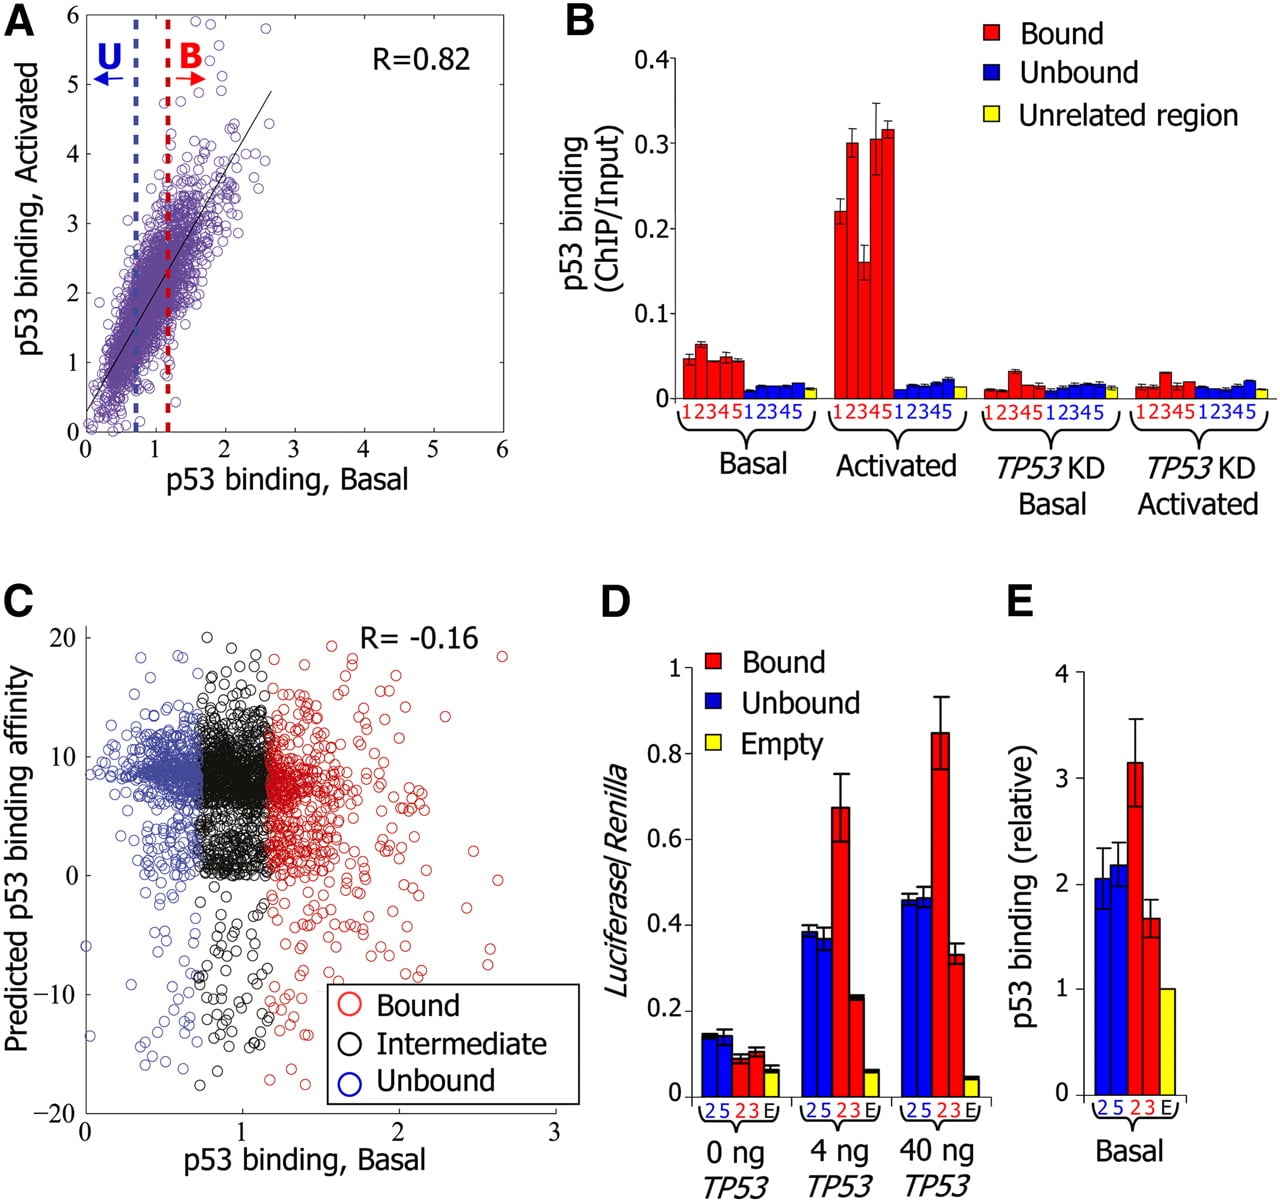
p53 sequence specificity is not a sufficient predictor of p53 binding in vivo. (A) For each of the putative p53-binding sites around which we measured p53 binding with a high-resolution tiling array, shown is the log-ratio between p53 ChIP and input-sonicated genomic DNA, averaged across the probes that tile the 500-bp region centered around the site. For each site, binding is shown for nonstressed MCF7 cells expressing endogenous wild-type p53 (p53 binding, Basal, x-axis), as well as for MCF7 cells in which p53 had been activated by exposure to the DNA damaging agent Neocarzinostatin (p53 binding, Activated, y-axis). The blue-dotted line marks the arbitrary binding cutoff in the basal condition below which we define sites as unbound (U, lowest 25% of the sites). The red-dotted line marks the cutoff above which we define sites as bound (B, highest 25% of the sites). The correlation between binding in basal and activated conditions across all sites is indicated. (B) Small-scale validation of p53 binding. ChIP was performed with antibodies against p53, followed by quantification by qPCR of ChIP vs. input-sonicated genomic DNA for five bound and five unbound sites, among which are the well-described sites at the CDKN1A (bound2), GADD45A (bound4), and MDM2 (bound5) genes, as defined in A (identifier numbers and full details of the sites are provided in Supplemental Table 1), as well as for one unrelated control region. Shown are the average and standard deviation (calculated from duplicate qPCR reactions) of p53-binding values at each site, for nonstressed MCF7 cells (Basal), MCF7 cells in which p53 was activated by Neocarzinostatin (Activated), MCF7 cells with shRNA-mediated stable TP53 knockdown (TP53KD, Basal), and MCF7 cells with stable TP53 knockdown treated with Neocarzinostatin (TP53KD, Activated). (C) p53-binding affinity is a poor predictor of p53 binding. For each of the putative p53-binding sites at which we measured p53 binding, shown is its predicted affinity for p53 using a log-ratio of a model of p53-binding specificities (Wei et al. 2006) to genome background (y-axis) and its measured binding in nonstressed MCF7 cells (p53 binding, Basal, x-axis). The correlation between predicted binding affinity and measured binding in the basal condition across all sites is indicated. Unbound and Bound are as in A; Intermediate corresponds to the remaining 50% of sites, defined as possessing intermediate p53 binding. (D) When cloned in a plasmid in front of a luciferase reporter gene, bound and unbound sites are equally effective in conferring p53 responsiveness. H1299 cells were transfected separately with luciferase plasmids carrying either bound or unbound sites as indicated, or no site (empty), together with increasing amounts of a TP53 expression plasmid (x-axis). Shown are averages and standard deviations (three biological replicates) of Firefly luciferase values, normalized by cotransfected Renilla luciferase reporter values. Full site details are shown in Supplemental Table 1. (E) When randomly integrated into the human genome, bound and unbound sites are equally bound by p53. HCT116 cells were stably transfected separately with luciferase plasmids carrying either bound or unbound sites or no site (empty), as indicated. ChIP was performed with antibodies against p53, followed by quantification by qPCR of ChIP vs. input-sonicated genomic DNA. Values for each site were divided by the values of p53 binding obtained from the empty plasmid. Shown are the average and standard deviation (calculated from duplicate qPCR reactions) of relative p53-binding values at each site.