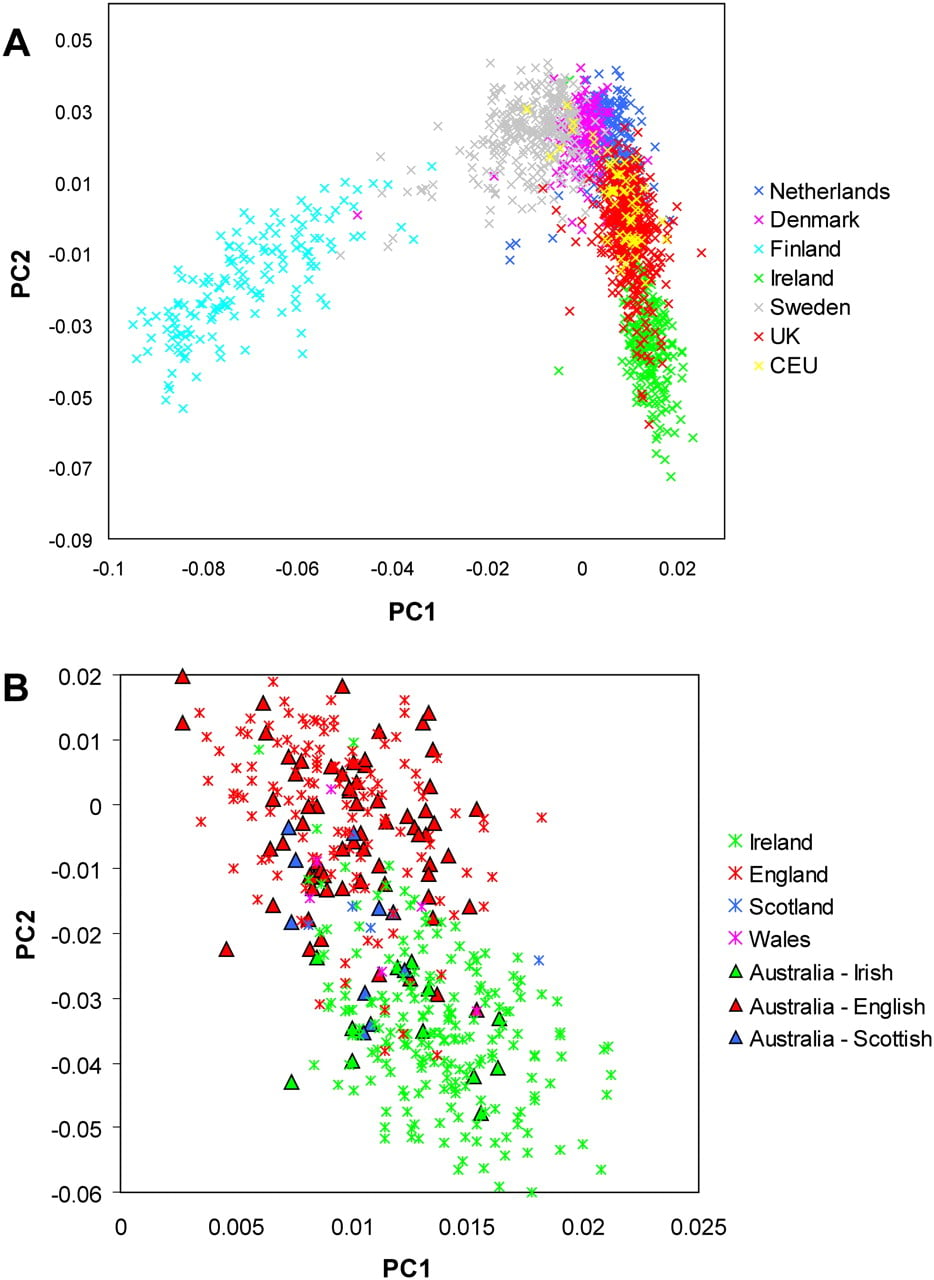
Figure 1.
PCA of Northern European population structure. (A) PC1 versus PC2 from 2051 individuals genotyped for 296,553 autosomal SNPs. PCA was conducted including the Australian sample (n = 451), but these are not shown here (see Supplemental Fig. S4). (B) PC1 versus PC2 focused on the United Kingdom, Irish, and Australian populations. For ease of illustration, PC1 has been constrained to between 0.02 and −0.06 and PC2 to between 0 and 0.025. Only those U.K. samples with birthplace information are displayed (n = 143), and these are distinguished as England, Scotland, and Wales. Australian samples whose four grandparental ancestries are from one country are also shown.